. 2014 Sep;17(9):1255-62.
doi: 10.1038/nn.3785. Epub 2014 Aug 10.

Sharp emergence of feature-selective sustained activity along the dorsal visual pathway

Affiliations

Sharp emergence of feature-selective sustained activity along the dorsal visual pathway

Diego Mendoza-Halliday et al. Nat Neurosci. 2014 Sep.

Abstract

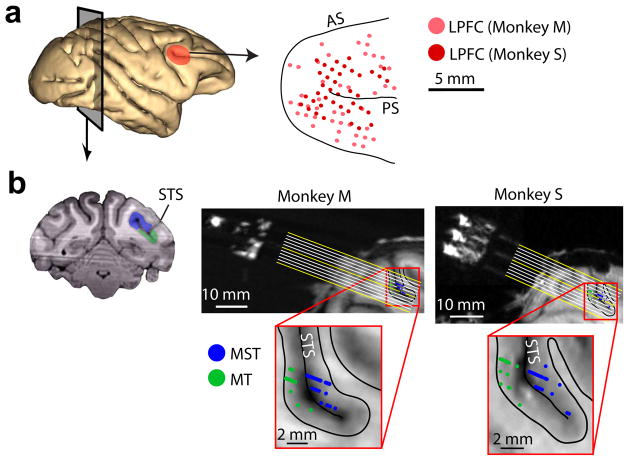
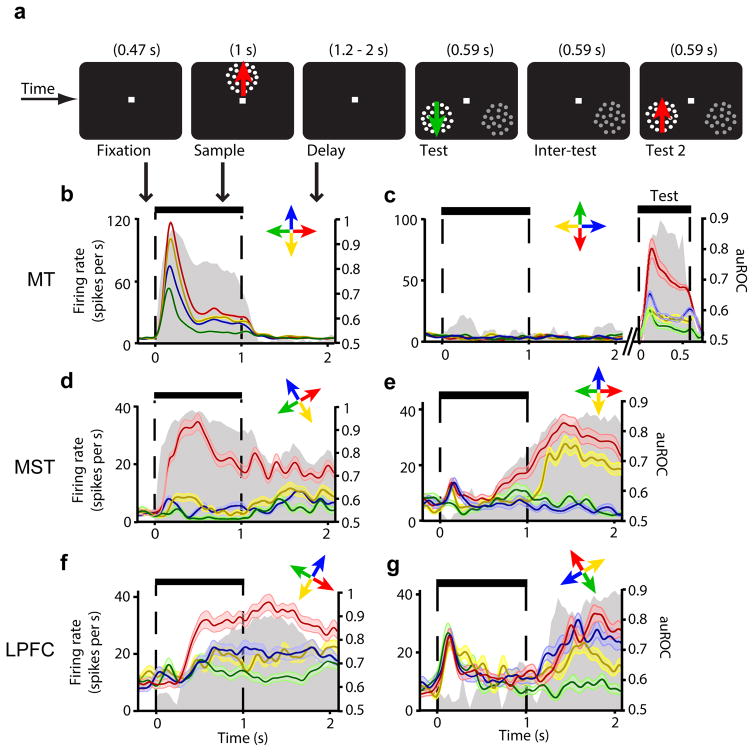
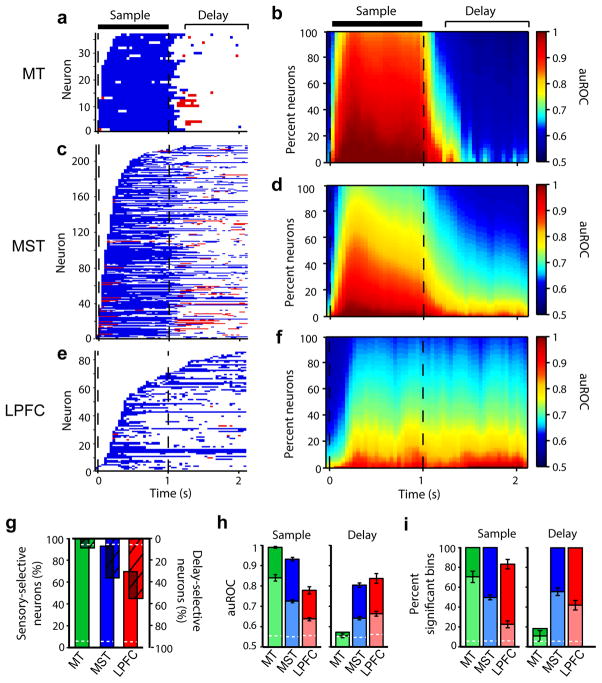
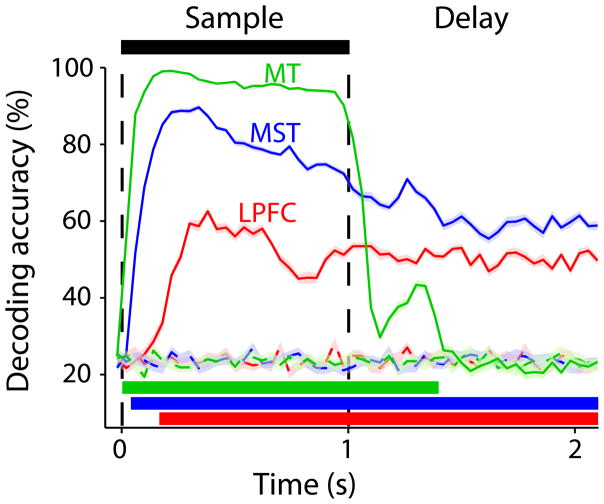
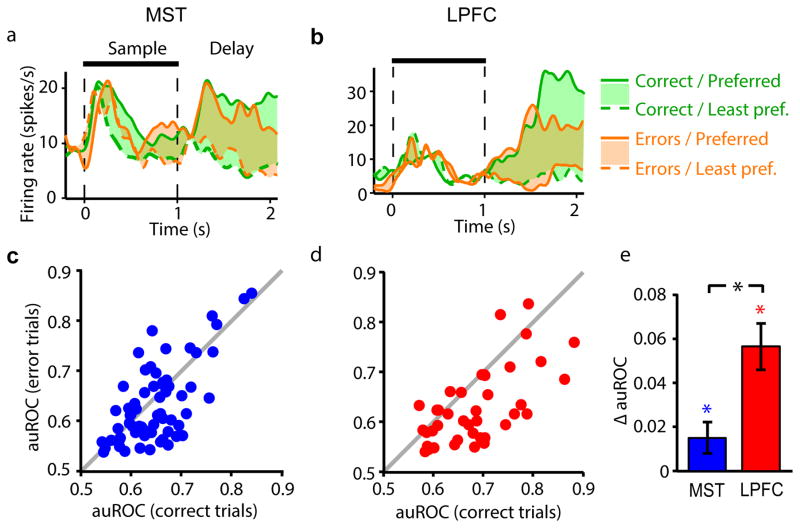
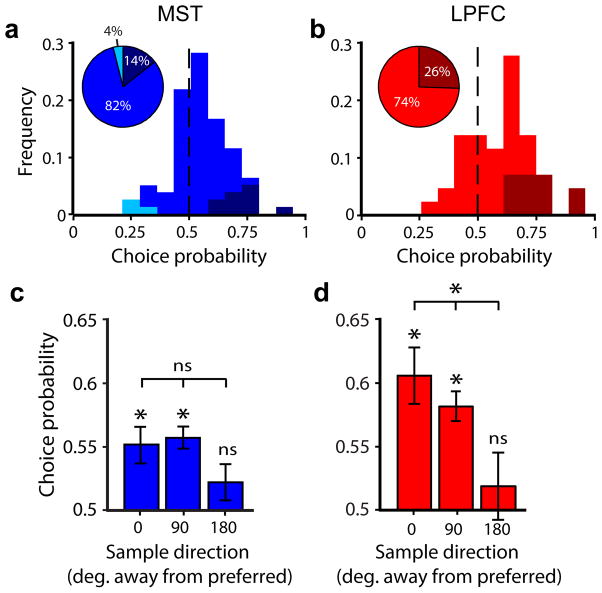
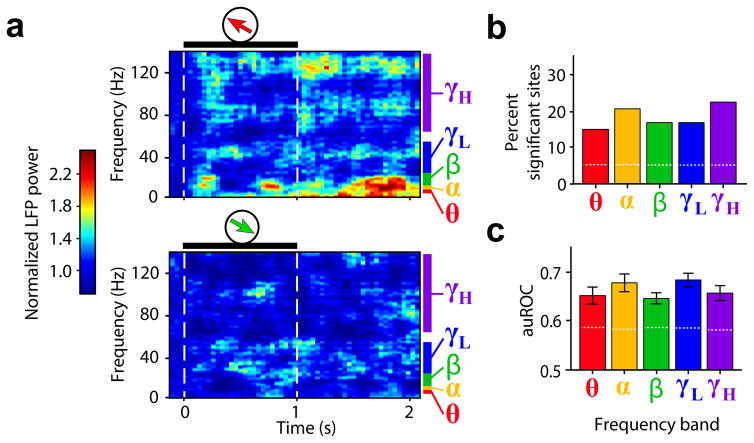
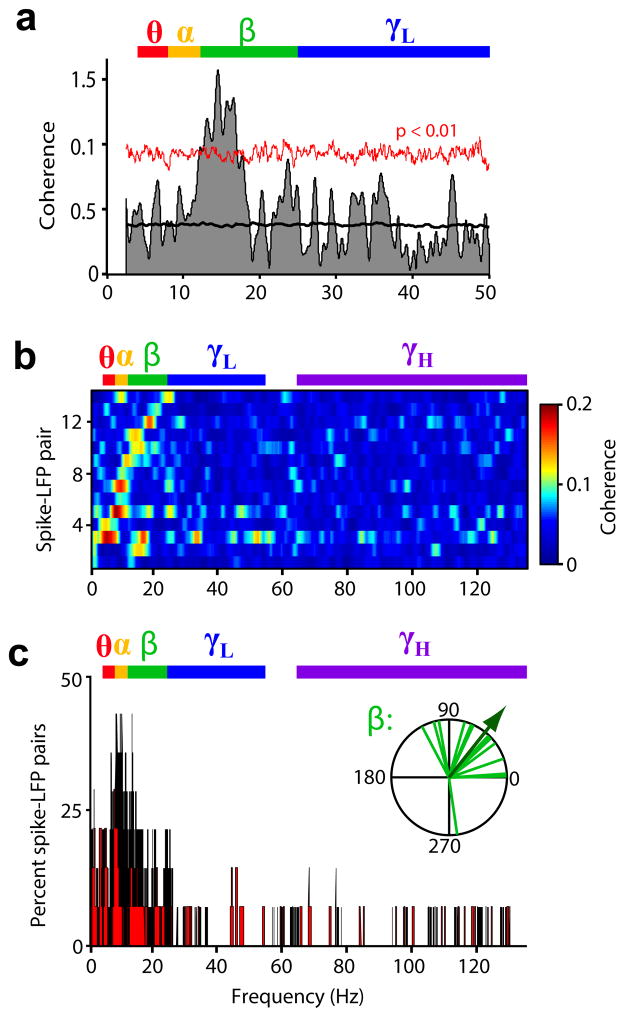
Sustained activity encoding visual working memory representations has been observed in several cortical areas of primates. Where along the visual pathways this activity emerges remains unknown. Here we show in macaques that sustained spiking activity encoding memorized visual motion directions is absent in direction-selective neurons in early visual area middle temporal (MT). However, it is robustly present immediately downstream, in multimodal association area medial superior temporal (MST), as well as and in the lateral prefrontal cortex (LPFC). This sharp emergence of sustained activity along the dorsal visual pathway suggests a functional boundary between early visual areas, which encode sensory inputs, and downstream association areas, which additionally encode mnemonic representations. Moreover, local field potential oscillations in MT encoded the memorized directions and, in the low frequencies, were phase-coherent with LPFC spikes. This suggests that LPFC sustained activity modulates synaptic activity in MT, a putative top-down mechanism by which memory signals influence stimulus processing in early visual cortex.


Conflict of interest statement

Competing interests statement: The authors declare no competing interests.

Figures

Figure 1
Figure 1. Anatomical location of recorded neurons
(a) Left, cortical surface showing LPFC (red). Right, location of LPFC recording sites with respect to arcuate (AS) and principal (PS) sulci. (b) Left, coronal MRI section showing MT (green) and MST (blue). Right, MRI section parallel to electrode trajectories (yellow and white lines) for each monkey, showing the location of all recorded neurons in MT (green) and MST (blue) projected onto that section. Bottom, close-up of recorded region. Black lines show gray/white matter boundaries. STS, superior temporal sulcus.
Figure 2
Figure 2. Firing rate across task periods for example neurons in MT, MST, and LPFC
(a) Visual display during all task periods. (b–g) Mean firing rate (± standard error) over time in trials with each of the four sample directions (color-coded arrows) for neuron examples in MT (a,b), MST (c,d), and LPFC (e,f). Each neuron’s preferred direction is shown in red. Gray area shows corresponding auROC over time (right axis label). In (b), the test stimuli, but not the sample, were placed inside the neuron’s receptive field, and colors during the test period represent test directions.
Figure 3
Figure 3. Direction discriminability in MT, MST and LPFC
(a,c,e) Time periods with significant direction discriminability (auROC) above (blue) and below (red) 0.5 for all neurons in MT (a), MST (c) and LPFC (e). (b,d,f) Average auROC across MT (b), MST (d) and LPFC (f) neurons over time as a function of the percentage of averaged neurons (organized from maximum to minimum auROC in each time bin). Sample and delay periods used for analysis are indicated. (g) Percentage of selective neurons with sensory-selectivity (upright solid bars), and delay-selectivity (inverted hashed bars). Because these percentages are computed from selective neurons, the bar overlaps represent neurons with both sensory- and delay-selectivity. (h–i) Mean auROC (h) and percent bins with significant auROC (i) during the sample and delay among all (light bars) and the top 10% (dark bars) of the neurons selective during each corresponding period. In g–i, dashed white lines show the values expected by chance. Error bars denote standard error of the mean.
Figure 4
Figure 4. Direction decoding accuracy for the populations of MT, MST and LPFC neurons
Mean (± standard error) sample direction decoding accuracy (percent of correctly decoded trials) over time for the neuronal populations in MT (green), MST (blue) and LPFC (red). Dashed lines, decoding accuracy expected by chance (see Online Methods). Horizontal color bars show periods with significant decoding accuracy for each area.
Figure 5
Figure 5. Relationship between task performance and delay period direction discriminability of MST and LPFC neurons
(a,b) Mean firing rate of example MST (a) and LPFC (b) neurons over time in correct (green) and error (orange) trials with preferred (solid lines) and least-preferred (dashed lines) sample direction. Colored areas show difference in activity between preferred and least-preferred sample trials. (c,d) Delay period auROC of delay-selective neurons in MST (c, blue dots) and LPFC (d, red dots) in correct (horizontal axis) vs. error trials (vertical axis). Gray, identity line. (e) Mean difference (± standard error) in delay period auROC between correct and error trials (ΔauROC = auROCcorrect − auROCerror) across MST and LPFC neurons. *, P < 0.05.
Figure 6
Figure 6. Choice probability of delay activity in MST and LPFC neurons
(a,b) Frequency histogram of delay period choice probability among delay-selective MST (a) and LPFC (b) neurons in preferred-sample trials. Vertical black dashed lines show chance choice probability. Color tones represent neurons with choice probability significantly above (darker tones), significantly below (lighter tones) and not significantly different from (middle tones) that expected by chance. (c,d) Mean choice probability (± standard error) among delay-selective MST (c) and LPFC (d) neurons as a function of sample direction with respect to each neuron’s preferred direction. *, P < 0.05; ns, non-significant.
Figure 7
Figure 7. Direction discriminability of LFP power in MT during working memory
(a) Mean normalized LFP spectrogram of an example recording site in MT during trials with preferred (top) and least-preferred (bottom) sample directions. Black horizontal bars and dashed lines delineate sample period. Frequency band ranges are color-coded. (b,c) For each frequency band, percent LFP sites in MT for which the LFP power auROC in the delay period was significantly higher than expected by chance (b), and mean LFP auROC (± standard error) among selective sites (c).
Figure 8
Figure 8. Spike-field synchrony between LPFC and MT during working memory
(a) Spike-field phase coherence (shaded area) of example LPFC-MT pair as a function of LFP frequency; mean coherence among randomized surrogates (black line) and confidence limit of P < 0.01 computed from surrogates (red line). (b) Spike-field coherence as a function of LFP frequency for all significantly coherent pairs, sorted by frequency at peak coherence. (c) Among coherent pairs, percent reaching significant coherence at each frequency. Inset, phase of coherence for all coherent pairs in the beta band (in degrees). Arrow indicates mean phase across pairs. Frequency bands are color-coded.

References

    1. Baddeley A. Working memory: theories, models, and controversies. Annu Rev Psychol. 2012;63:1–29. - PubMed
    1. Funahashi S, Bruce CJ, Goldman-Rakic PS. Mnemonic coding of visual space in the monkey’s dorsolateral prefrontal cortex. J Neurophysiol. 1989;61:331–349. - PubMed
    1. Miller E, Erickson C, Desimone R. Neural mechanisms of visual working memory in prefrontal cortex of the macaque. J Neurosci. 1996;16:5154–5167. - PMC - PubMed
    1. Andersen RA, Essick GK, Siegel RM. Neurons of area 7 activated by both visual stimuli and oculomotor behavior. Exp Brain Res. 1987;67:316–322. - PubMed
    1. Miller EK, Li L, Desimone R. A neural mechanism for working and recognition memory in inferior temporal cortex. Science. 1991;254:1377–1379. - PubMed

Publication types

MeSH terms

LinkOut - more resources