. 2014 Sep;17(9):1198-207.
doi: 10.1038/nn.3783. Epub 2014 Aug 10.

Cocaine exposure reorganizes cell type- and input-specific connectivity in the nucleus accumbens

Affiliations

Cocaine exposure reorganizes cell type- and input-specific connectivity in the nucleus accumbens

Andrew F MacAskill et al. Nat Neurosci. 2014 Sep.

Abstract

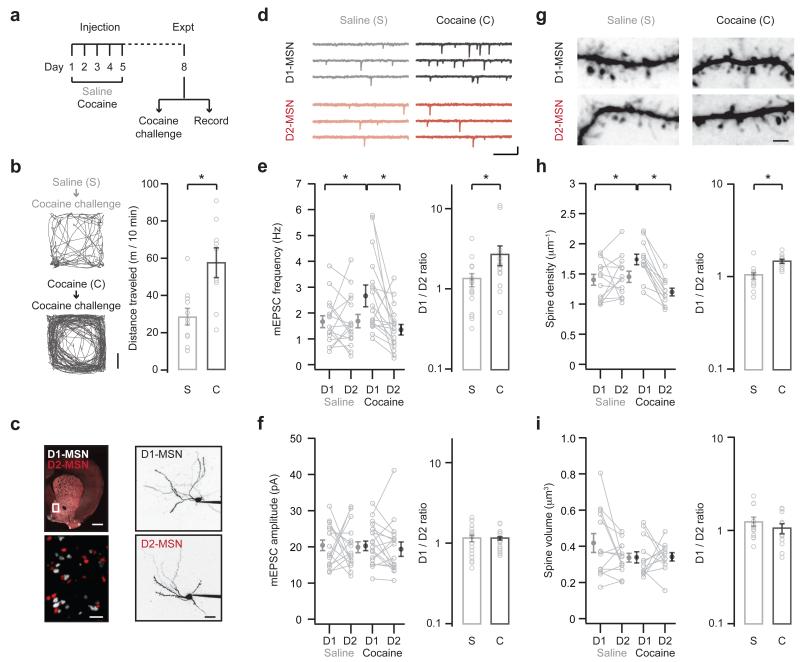
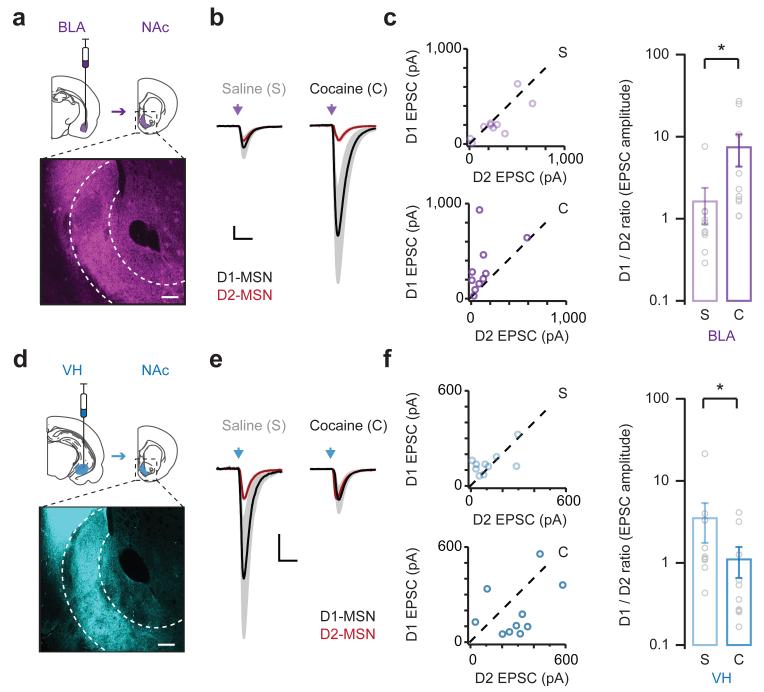
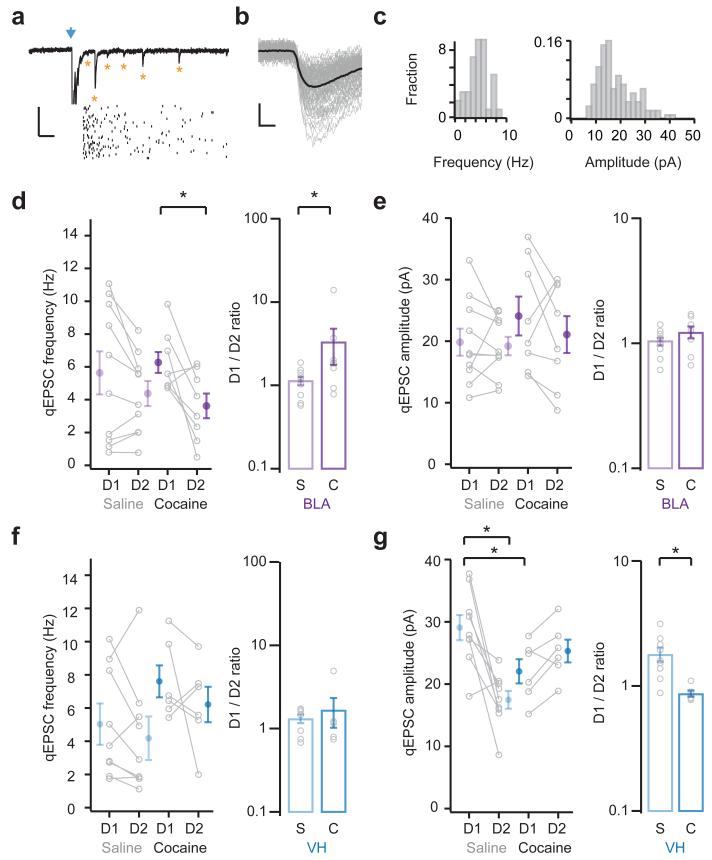
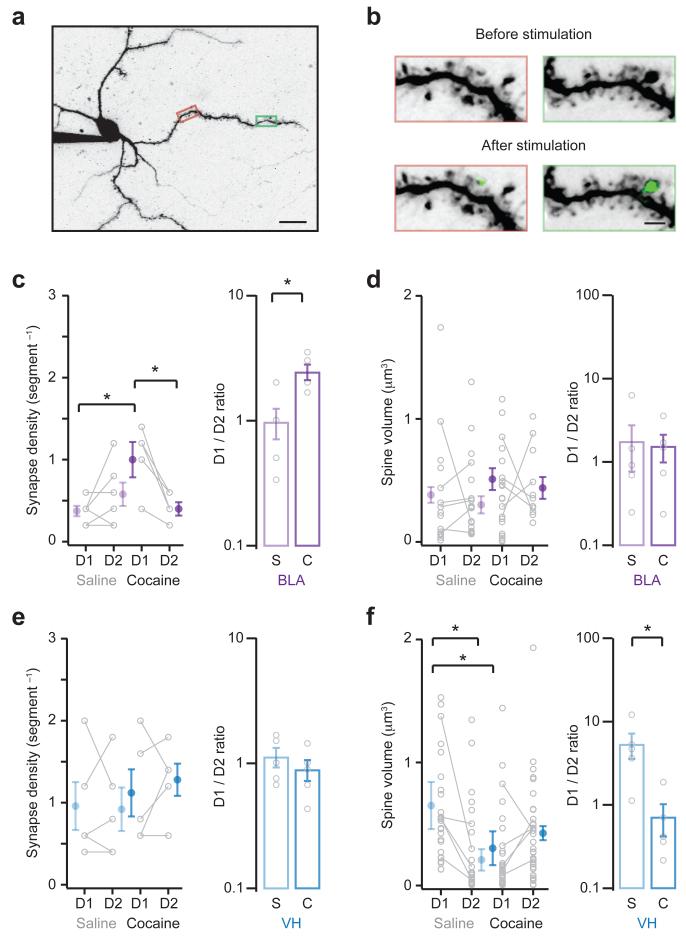
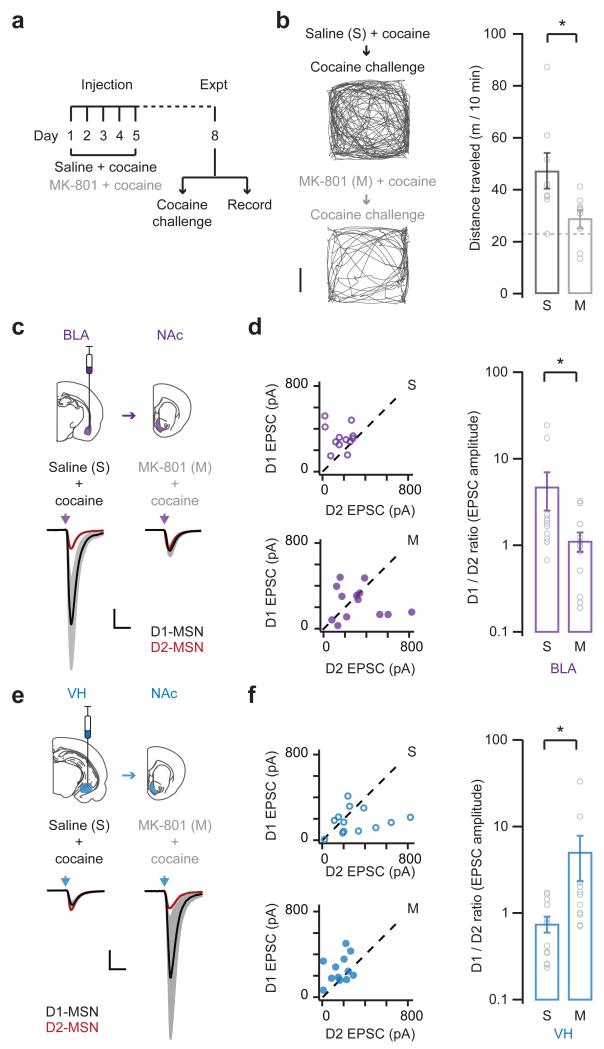
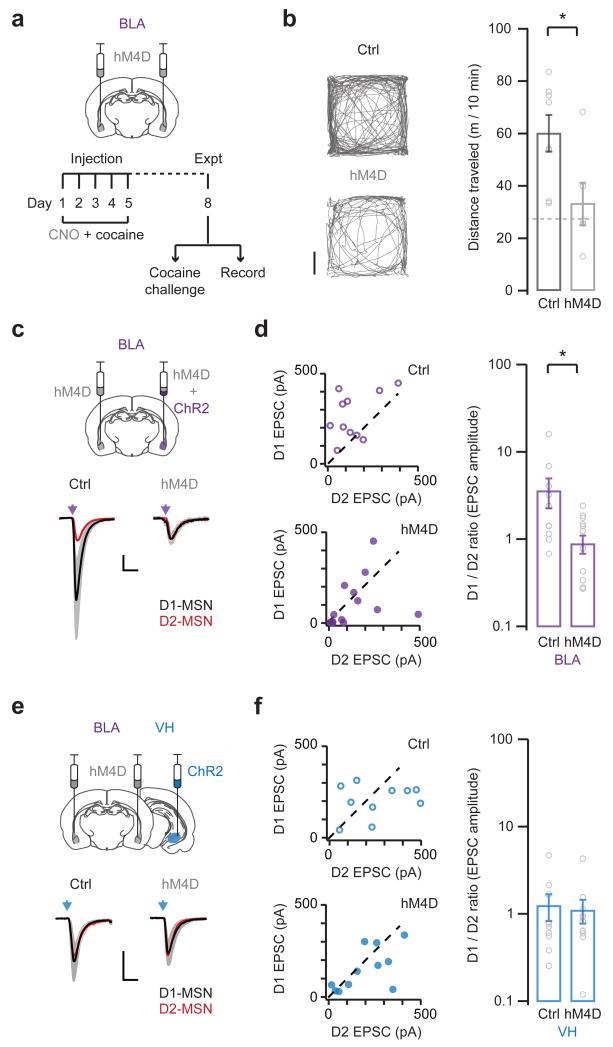
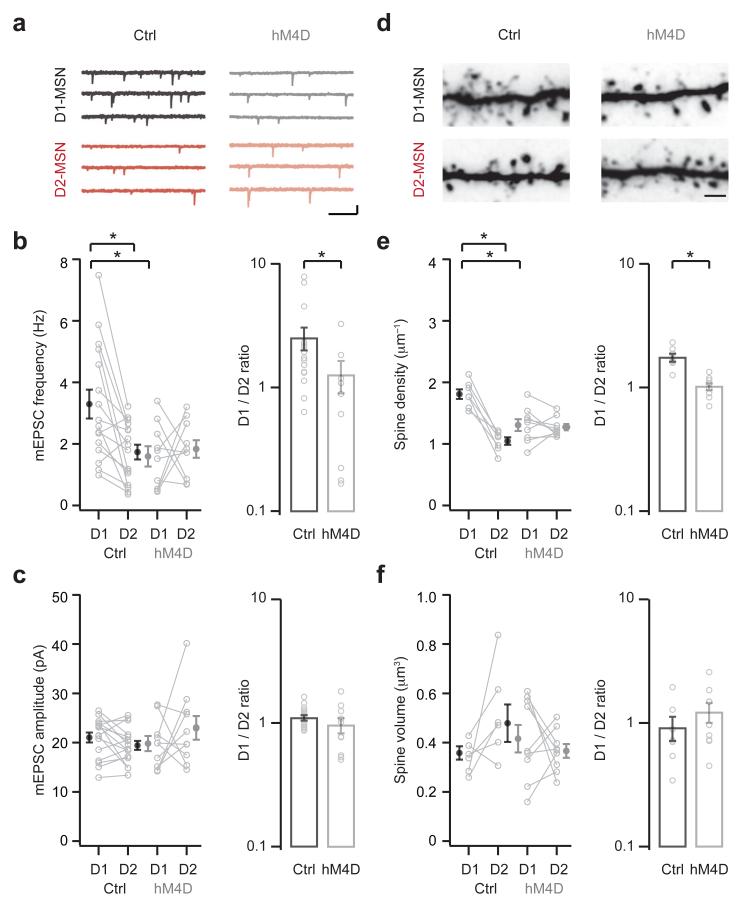
Repeated exposure to cocaine alters the structural and functional properties of medium spiny neurons (MSNs) in the nucleus accumbens (NAc). These changes suggest a rewiring of the NAc circuit, with an enhancement of excitatory synaptic connections onto MSNs. However, it is unknown how drug exposure alters the balance of long-range afferents onto different cell types in the NAc. Here we used whole-cell recordings, two-photon microscopy, optogenetics and pharmacogenetics to show how repeated cocaine exposure alters connectivity in the mouse NAc medial shell. Cocaine selectively enhanced amygdala innervation of MSNs expressing D1 dopamine receptors (D1-MSNs) relative to D2-MSNs. We also found that amygdala activity was required for cocaine-induced changes to behavior and connectivity. Finally, we established how heightened amygdala innervation can explain the structural and functional changes evoked by cocaine. Our findings reveal how exposure to drugs of abuse fundamentally reorganizes cell type- and input-specific connectivity in the NAc.


Figures

Figure 1
Figure 1. Repeated cocaine enhances excitatory connectivity
a. Schematic of experimental protocol. Cocaine or saline was injected once a day for 5 days. On day 8, animals either received a cocaine challenge to monitor behavioral sensitization (b), or slices were prepared to study the impact on NAc circuitry (c – i). Note that no cocaine challenge was given to animals used for electrophysiology. b. (Left) Locomotion of saline (top) or cocaine (bottom) mice, measured for 10 min immediately after a cocaine challenge on day 8. Scale bar = 5 cm. (Right) Summary of distance traveled by saline (s) and cocaine (c) mice after the cocaine challenge. Note that mice with previous exposure to cocaine show more pronounced locomotion (U = 14, p = 0.006, Mann-Whitney; n = 11 (s), 9 (c) mice). c. (Left) Coronal slice from a D1-tdTomato+/− / D2-EGFP+/− mouse, showing D1- (white) and D2- (red) MSNs. Boxed region in NAc medial shell is magnified. Note the easily identifiable cell bodies. Scale bar = 500 μm. (Right) Two-photon images of D1- (top) and D2- (bottom) MSNs filled via the patch pipette with Alexa Fluor 594. Scale bar = 20 μm. d. mEPSCs at neighboring D1- (top) and D2- (bottom) MSNs from mice treated with saline (left) or cocaine (right). Scale bars = 10 pA, 200 ms. e. Summary of mEPSC frequency at D1- and D2-MSNs from saline (s) and cocaine (c) mice. Raw data is shown on the left, and the ratio of mEPSC frequency at pairs of neighboring D1- and D2-MSNs is shown on the right. Note that ratios are plotted on a log axis. Cocaine increases the frequency of mEPSCs at D1-MSNs, thereby increasing the D1/D2 ratio (interaction between drug and cell-type, F(1,64) = 5.7, p = 0.02, two-way ANOVA; D1-cocaine p < 0.05 compared to D1-saline and D2-cocaine, Tukey’s post-hoc test; D1/D2 ratio: U = 75, p = 0.02, Mann-Whitney; n = 16 (s), 18 (c) pairs). f. Summary of mEPSC amplitude at D1- and D2-MSNs from saline (s) and cocaine (c) mice. Note that cocaine does not alter the amplitude of mEPSCs at D1- or D2-MSNs (no significant effects, two-way ANOVA; D1/D2 ratio: U = 133, p = 0.72, Mann-Whitney). g. Two-photon images of dendrites and spines at D1- (top) and D2- (bottom) MSNs from saline (left) or cocaine (right) mice. Scale bar = 2 μm. h. Summary of spine density at D1- and D2-MSNs in saline (s) and cocaine (c) mice. Raw data is shown on the left, while the ratio of spine density at pairs of neighboring D1- and D2-MSNs is shown on the right. Cocaine increases the spine density at D1-MSNs, thereby increasing the D1/D2 ratio (interaction between drug and cell type, F(1,46) = 12.1, p = 0.001, two-way ANOVA; D1-cocaine p < 0.05 compared to D1-saline and D2-cocaine, Tukey’s post-hoc test; D1/D2 ratio: U = 14, p < 0.001, Mann-Whitney; n = 13 (s), 12 (c) pairs). i. Summary of spine volume at D1- and D2-MSNs in saline (s) and cocaine (c) mice. Note that cocaine does not alter the spine volume at D1- or D2-MSNs (no significant effects, two-way ANOVA; D1/D2 ratio: U = 58, p = 0.29, Mann-Whitney). Bar graphs show mean ± SEM. * denotes p < 0.05.
Figure 2
Figure 2. Synaptic plasticity is cell-type and input-specific
a. (Top) Schematic of AAV9-CAG-hChR2-mCherry injection into the basolateral amygdala (BLA, purple) and projection to the NAc. (Bottom) Coronal section of the NAc medial shell (dotted outline), showing distribution of BLA afferents. Scale bar = 100 μm. b. Light-evoked BLA EPSCs at D1-MSNs (mean in black, error in grey) and D2-MSNs (mean in red, error in pink) on day 8 from animals injected with saline (left) or cocaine (right) on days 1 to 5. EPSCs at D1-MSNs are scaled to those at neighboring D2-MSNs. Scale bar = unity, 20 ms. c. (Left) Summary of BLA EPSCs at D1- and D2-MSNs in saline (top) and cocaine (bottom) mice. (Right) Summary of D1/D2 ratio of BLA EPSCs. Note that cocaine biases BLA EPSCs towards D1-MSNs, thereby increasing the D1/D2 ratio (D1/D2 ratio: U = 11, p = 0.002, Mann-Whitney; n = 10 (s), 10 (c) pairs). d – f. Similar to (a – c) for ventral hippocampus inputs (VH, blue). Note that cocaine normalizes VH EPSCs at D1- and D2-MSNs, thereby reducing the D1/D2 ratio (D1/D2 ratio: U = 25, p 0.02, Mann-Whitney; n = 11 (s), 11 (c) pairs). Bar graphs show mean ± SEM. * denotes p < 0.05.
Figure 3
Figure 3. Changes to the number and strength of connections
a. (Top) Light-evoked basolateral amygdala (BLA) qEPSCs recorded in the presence of strontium. Blue arrow indicates light pulse. Asterisks indicate qEPSCs. (Bottom) Raster plot showing qEPSCs detected on individual trials. Scale bar = 30 pA, 100 ms. b. Overlay of individual (grey) and average (black) onset-aligned qEPSCs from example in (a). Scale bar = 10 pA, 2 ms. c. Histogram of qEPSC frequency (left) and amplitude (right) from example in (a). d. (Left) Summary of the frequency of BLA qEPSCs at D1- and D2-MSNs in saline (s) or cocaine (c) mice. (Right) Summary of D1/D2 ratio of BLA qEPSC frequency. Note that cocaine increases BLA qEPSC frequency at D1-MSNs (t(7) = 2.9, p = 0.02, paired t-test; D1/D2 ratio: U = 16, p = 0.03, Mann-Whitney; n = 10 (s), 8 (c) pairs). e. (Left) Summary of the amplitude of BLA qEPSCs at D1- and D2-MSNs in saline (s) or cocaine (c) mice. (Right) Summary of D1/D2 ratio of BLA qEPSC amplitude. Note that cocaine has no effect on BLA qEPSC amplitude (no significant effects, two-way ANOVA; D1/D2 ratio: U = 25, p = 0.2, Mann-Whitney). f, g. Similar to (d, e) for ventral hippocampus inputs (VH). Note that cocaine has no impact on the frequency of VH qEPSCs (D1/D2 ratio: U = 21, p = 0.53, Mann-Whitney; n = 9 (s), 6 (c) pairs), but reduces their amplitude at D1-MSNs (interaction between drug and cell type, F(1,26) = 162.7, p < 0.001; D1-saline p < 0.05 compared to D1-cocaine and D2-saline, Tukey’s post-hoc test; D1/D2 ratio: U = 2, p = 0.002, Mann-Whitney). Bar graphs show mean ± SEM. * denotes p < 0.05.
Figure 4
Figure 4. Alterations to structural connections at dendritic spines
a. Two-photon image of MSN filled with Alexa Fluor 594 and Fluo-4FF via the patch pipette, showing dendrites and spines. b. Boxed areas in (a) are enlarged to show before (top) and after (bottom) light stimulation of ChR2-expressing VH inputs. Synaptic connections are detected by calcium signals (green) at individual dendritic spines. Scale bars = 20 μm and 2 μm. c. (Left) Summary of density of BLA synapses at D1- and D2-MSNs in saline (s) or cocaine (c) mice. (Right) Summary of D1/D2 ratio of BLA synapse density. Cocaine increases BLA synapse density at D1-MSNs (interaction between drug and cell type, F(1,18) = 10.0, p = 0.005, two-way ANOVA; D1-cocaine p < 0.05 compared to D1-saline and D2-cocaine, Tukey’s post-hoc test; D1/D1ratio: U = 2, p = 0.02, Mann-Whitney; n = 6 (s), 5(c) pairs). d. (Left) Summary of volume of spines contacted by BLA inputs at D1- and D2-MSNs in saline (s) or cocaine (c) mice. (Right) Summary of D1/D2 ratio of BLA spine volume. Note that cocaine does not alter BLA spine volume (no significant effects, two-way ANOVA; D1/D2 ratio: U = 13, p = 0.79, Mann-Whitney). e, f. Similar to (c, d) for VH inputs. Note that cocaine has no effect on VH synapse density (no significant effects, two-way ANOVA; D1/D2 ratio: U = 8, p = 0.41, Mann-Whitney; n = 5 (s), 5 (c) pairs), but decreases VH spine volume at D1-MSNs (interaction between drug and cell type, F(1,99) = 11.1, p = 0.001, two-way ANOVA; D1-saline p < 0.05 compared to D1-cocaine and D2-saline, Tukey’s post-hoc test; D1/D2 ratio: U = 1, p = 0.02, Mann-Whitney). Bar graphs show mean ± SEM. * denotes p < 0.05.
Figure 5
Figure 5. Synaptic reorganization depends on NMDA-Rs
a. Schematic of experimental protocol. Mice were pretreated with MK-801 or saline 30 min before each cocaine injection on days 1 to 5, followed by either a cocaine challenge on day 8 to monitor behavioral sensitization (b), or electrophysiology on day 8 without a cocaine challenge to assess synaptic connectivity (c – f). b. (Left) Locomotion of saline- (top) or MK-801- (bottom) pretreated mice, measured for 10 min immediately after a cocaine challenge on day 8. Scale bar = 5 cm. (Right) Summary of distance traveled by saline- (s) and MK-801- (m) pretreated mice after the cocaine challenge. Dashed line indicates saline control. Note that MK-801 abolishes behavioral sensitization (U = 10, p = 0.01, Mann-Whitney; n = 8 (s), 9 (m) mice). c. (Top) Schematic of AAV-hChR2-mCherry injection in basolateral amygdala (BLA, purple) and projections to the NAc. (Bottom) Light-evoked BLA EPSCs at D1- (black) and D2- (red) MSNs from saline- (left) and MK-801- (right) pretreated mice. BLA EPSCs at D1-MSNs are scaled to neighboring D2-MSNs. Scale bar = unity, 20 ms. d. (Left) Summary of BLA EPSCs at D1- (top) and D2- (bottom) MSNs in saline- (s) and MK-801- (m) pretreated mice. (Right) Summary of D1/D2 ratio of BLA EPSCs. Note that MK-801 prevents the biasing of BLA EPSCs onto D1-MSNs (D1/D2 ratio: U = 34, p = 0.02, Mann-Whitney; n = 12 (s), 13 (m) pairs). e, f. Similar to (c, d) for ventral hippocampus inputs (VH). Note that MK-801 also prevents the normalization of VH EPSCs at D1- and D2-MSNs (D1/D2 ratio: U = 25, p = 0.01, Mann-Whitney; n = 13 (s), 11 (m) pairs). Bar graphs show mean ± SEM. * denotes p < 0.05.
Figure 6
Figure 6. Enhancement of BLA inputs depends on BLA activity
a. Schematic of experimental protocol. (Top) Mice were injected with AAVs to bilaterally express hM4D in the basolateral amygdala (BLA). (Bottom) Two weeks later, mice were pretreated with CNO 30 min before each cocaine injection on days 1 to 5, followed by a cocaine challenge on day 8 to monitor behavioral sensitization (b), or electrophysiology on day 8 without a cocaine challenge to assess synaptic connectivity (c – f). b. (Left) Locomotion of control (top) or hM4D-expressing (bottom) mice, measured for 10 min immediately after a cocaine challenge on day 8. Scale bar = 5 cm. (Right) Summary of distance traveled by control or hM4D-expressing mice after the cocaine challenge. Dashed line indicates saline control. Note that inhibiting BLA activity abolishes behavioral sensitization (U = 6, p = 0.02 Mann-Whitney; n = 8 (Ctrl), 6 (hM4D) mice). c. (Top) Schematic of AAV injection to express hM4D or control GFP bilaterally in the BLA, and ChR2 unilaterally in the BLA. (Bottom) Light-evoked BLA EPSCs at D1- (black) and D2- (red) MSNs from control (left) and hM4D-expressing (right) mice. EPSCs at D1-MSNs are scaled to neighboring D2-MSNs. Scale bar = unity, 20 ms. d. (Left) Summary of BLA EPSCs at D1- (top) and D2- (bottom) MSNs in control (top) and hM4D-expressing (bottom) mice. (Right) Summary of D1/D2 ratio of BLA EPSCs. Note that inhibiting BLA activity prevents the biasing of BLA EPSCs onto D1-MSNs (D1/D2 ratio: U = 32, p = 0.01, Mann-Whitney; n = 11 (Ctrl), 14 (hM4D) pairs). e, f. Similar to (c, d), with hM4D or control GFP expressed bilaterally in the BLA, and ChR2 expressed unilaterally in the ventral hippocampus (VH). Note that inhibiting BLA activity does not reverse the normalization of VH EPSCs at D1- and D2-MSNs (D1/D2 ratio: U = 53, p = 0.92, Mann-Whitney; n = 10 (Ctrl), 11 (hM4D) pairs). Bar graphs show mean ± SEM. * denotes p < 0.05.
Figure 7
Figure 7. Enhanced connectivity reflects BLA innervation
Mice were injected with AAVs to express hM4D or control GFP bilaterally in the basolateral amygdala (BLA). Two weeks later, mice were pretreated with CNO 30 min before each cocaine injection on days 1 to 5, followed by electrophysiology on day 8 without cocaine challenge. a. mEPSCs from neighboring D1- (top) and D2- (bottom) MSNs in control (left) or hM4D-expressing (right) mice. Scale bar = 10 pA, 200 ms. b. Summary of mEPSC frequency at D1- and D2-MSNs in control and hM4D-expressing mice. Note that inhibiting BLA activity blocks the cocaine-induced increase in mEPSC frequency at D1-MSNs (interaction between treatment and cell type, F(1,48) = 5.7, p = 0.02, two-way ANOVA; D1-control p < 0.05 compared to D1-hM4D and D2-control, Tukey’s post-hoc test; D1/D2 ratio: U = 41, p = 0.04, Mann-Whitney; n = 16 (Ctrl), 10 (hM4D) pairs). c. Summary of mEPSC amplitude at D1- and D2-MSNs in control and hM4D-expressing mice. Note no difference in mEPSC amplitude across conditions (no significant effects, two-way ANOVA; D1/D2 ratio: U = 58, p = 0.26, Mann-Whitney). d. Two-photon images of dendrites and spines at neighboring D1- (top) and D2- (bottom) MSNs in control (left) or hM4D-expressing (right) mice. Scale bar = 2 μm. e. Summary of spine density at D1- and D2-MSNs in control and hM4D-expressing mice. Note that inhibiting BLA activity blocks the cocaine-induced increase in spine density at D1-MSNs (interaction between treatment and cell type, F(1,28) = 23.4, p < 0.001, two-way ANOVA; D1-control p < 0.05 compared to D1-hM4D and D2-control, Tukey’s post-hoc test; D1/D2 ratio: U = 1, p < 0.001, Mann-Whitney; n = 7 (Ctrl), 9 (hM4D) pairs). f. Summary of spine volume at D1- and D2-MSNs in control and hM4D-expressing mice. Note no difference in spine volume across conditions (no significant effects, two-way ANOVA; D1/D2 ratio: U = 21, p = 0.3, Mann-Whitney). Bar graphs show mean ± SEM. * denotes p < 0.05.

References

    1. Humphries MD, Prescott TJ. The ventral basal ganglia, a selection mechanism at the crossroads of space, strategy, and reward. Progress in Neurobiology. 2010;90:385–417. - PubMed
    1. Sesack SR, Grace AA. Cortico-Basal Ganglia reward network: microcircuitry. Neuropsychopharmacology. 2010;35:27–47. - PMC - PubMed
    1. Wilson CJ. In: The Synaptic Organization of the Brain. Shepherd GM, editor. Oxford University Press; 2004.
    1. Hyman SE, Malenka RC, Nestler EJ. Neural mechanisms of addiction: the role of reward-related learning and memory. Annual Review of Neuroscience. 2006;29:565–598. - PubMed
    1. Kalivas PW. The glutamate homeostasis hypothesis of addiction. Nature Reviews. Neuroscience. 2009;10:561–572. - PubMed

Publication types

MeSH terms

LinkOut - more resources