. 2014 Sep 7;59(17):4927-43.
doi: 10.1088/0031-9155/59/17/4927. Epub 2014 Aug 11.

Trapping of embolic particles in a vessel phantom by cavitation-enhanced acoustic streaming

Affiliations

Trapping of embolic particles in a vessel phantom by cavitation-enhanced acoustic streaming

Adam D Maxwell et al. Phys Med Biol. .

Abstract

Cavitation clouds generated by short, high-amplitude, focused ultrasound pulses were previously observed to attract, trap, and erode thrombus fragments in a vessel phantom. This phenomenon may offer a noninvasive method to capture and eliminate embolic fragments flowing through the bloodstream during a cardiovascular intervention. In this article, the mechanism of embolus trapping was explored by particle image velocimetry (PIV). PIV was used to examine the fluid streaming patterns generated by ultrasound in a vessel phantom with and without crossflow of blood-mimicking fluid. Cavitation enhanced streaming, which generated fluid vortices adjacent to the focus. The focal streaming velocity, uf, was as high as 120 cm/s, while mean crossflow velocities, uc, were imposed up to 14 cm/s. When a solid particle 3-4 mm diameter was introduced into crossflow, it was trapped near the focus. Increasing uf promoted particle trapping while increasing uc promoted particle escape. The maximum crossflow Reynolds number at which particles could be trapped, Rec, was approximately linear with focal streaming number, Ref, i.e. Rec = 0.25Ref + 67.44 (R(2) = 0.76) corresponding to dimensional velocities uc = 0.084uf + 3.122 for 20 < uf < 120 cm/s. The fluidic pressure map was estimated from PIV and indicated a negative pressure gradient towards the focus, trapping the embolus near this location.


Figures
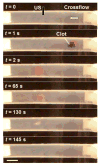
Figure 1
Figure 1
Photograph sequence showing trapping and erosion of a 4 mm clot particle against a crossflow (white arrow) near an ultrasound-induced cavitation cloud in a polyethylene tube. Ultrasound (US) propagation is from top to bottom of the image and the focus is aligned with the center of the tube diameter (black arrow). The cavitation cloud is present, but not visualized in these images. The particle entered the cloud at t = 2 s and was trapped slightly downstream from the focus between t = 2 - 145 s. Within the same time span, the cavitation caused erosion of the clot particle into small debris. The scale bar in the lower left is 5 mm.
Figure 2
Figure 2
A top-down schematic of the experimental setup used for PIV of the vessel phantom during application of ultrasound. A circulatory flow was generated by a pump to continuously cycle a glycerol/water solution containing PIV tracers through the phantom. The ultrasound transducer was focused into the vessel phantom transverse to the circulatory flow, driven by a class D amplifier. A high-speed camera was used to capture a sequence of images in the vessel phantom during ultrasound application. Illumination was provided by a light sheet produced by a Nd:YAG 532 nm laser.
Figure 3
Figure 3
Time-averaged photograph (top) and PIV velocity map (bottom) of fluid flow pattern created by cavitation-induced streaming in the vessel phantom. No crossflow or embolic particles were present in this experiment. The black arrow in the top frame indicates the direction of acoustic propagation and position of the beam axis. The vectors in the PIV frame indicate the direction and magnitude of flow, and the color map in the PIV frame shows fluid velocity magnitude. The ultrasound PRF was 400 Hz and PD was 10 cycles during this exposure. The flow pattern shows the highest velocity was generated at the focus towards the distal wall of the tube, with vortices forming on either side. The scale bar in the lower left is 5 mm.
Figure 4
Figure 4
Peak streaming velocities at the focus uf vs. PD for 5 different sets of PRF between 200 – 2000 Hz. Increasing either PD or PRF results in an increase in streaming velocity at the focus, although a limitation of the peak velocity is seen between PRF = 1000 and PRF = 2000. Each point represents the mean value of n = 30 measurements.
Figure 5
Figure 5
Time-averaged photographs (left) and velocity maps (right) around the focus under increasing crossflow velocity. The mean crossflow velocity, uc, is shown on the left. For this experiment, PD = 5 cycles and PRF = 400 Hz. The white arrow in the left frame at uc = 2 cm/s shows the direction of crossflow. The colorbar on the right gives the velocity magnitude scale in m/s. The scale bar in the lower left is 5 mm.
Figure 6
Figure 6
Time-averaged image of a particle trapped in the fluid vortex adjacent to the acoustic focus. The cavitation cloud is visualized at the center of the upper frame, with the particle on the left. The red trace shows the calculated trajectory of the particle centroid over 1.5 seconds. The trajectory consisted of small circular motions about the center of the vortex. The scale bar in the lower right is 5 mm.
Figure 7
Figure 7
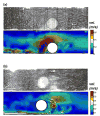
(a) Time-averaged image and fluid velocity map of a particle trapped upstream from the focus. Mean crossflow velocity was 8 cm/s and the particle diameter was 3 mm. (b) Time-averaged image and flow velocity map of a particle trapped downstream from the focus. The mean crossflow velocity was 10 cm/s and the particle diameter is 3 mm. In both (a) and (b), the applied PRF = 1000 Hz and PD = 10 cycles. The scale bar in the lower left is 5 mm.
Figure 8
Figure 8
Reynolds number Rec at which 3-4 mm particles escaped trapping vs. focal Reynolds number Ref for different acoustic parameter sets. As either PRF or PD is increased, the particles were trapped against a higher crossflow velocity. The black dashed line shows a linear least-squares fit to the data. The horizontal error bars are standard deviation in measurement for Ref while vertical error bars are standard deviation in the Rec at which particles escaped the focal region.
Figure 9
Figure 9
Velocity (left) and coefficient of pressure Cp (right) maps of the corresponding fluid flow patterns displayed in Fig. 5. The color bar on the right indicates the magnitude Cp for the pressure map. Pressure maps show a negative pressure gradient towards the focus. As crossflow velocity is increased, the pressure pattern still indicates a negative gradient towards the focus, but the value of the pressure coefficient is reduced. The scale bar in the lower left is 5 mm.
Figure 10
Figure 10
Minimum pressure coefficient (-Cp) vs. crossflow velocity uc for four sets of data using different PD and PRF. In general, pressure coefficient decreases with increasing crossflow velocity. 3 - 4 mm particles were found to escape near Cp = -9.6 +/- 4.0 across different acoustic parameters.

References

    1. Ames WF. Numerical methods for partial differential equations. San Diego: Academic Press; 1992.
    1. Ashkin A, Dziedzic JM, Bjorkholm JE, Chu S. Observation of a single-beam gradient force optical trap for dielectric particles. Opt Lett. 1986;11:288–290. - PubMed
    1. Chen WS, Brayman AA, Matula TJ, Crum LA, Miller MW. The pulse length-dependence of inertial cavitation dose and hemolysis. Ultrasound Med Biol. 2003;29:739–748. - PubMed
    1. Coakley WT, Bardsley DW, Grundy MA, Zamani F, Clarke DJ. Cell manipulation in ultrasonic standing wave fields. J Chem Technol Biotechnol. 1989;44:43–62.
    1. Crowe C, Sommerfeld M, Tsuji Y. Multiphase flows with droplets and particles. Boca Raton: CRC Press; 1998.

Publication types

LinkOut - more resources