. 2014 Aug 14;158(4):778-792.
doi: 10.1016/j.cell.2014.07.023. Epub 2014 Aug 7.

Structure and dynamics of AMPA receptor GluA2 in resting, pre-open, and desensitized states

Affiliations

Structure and dynamics of AMPA receptor GluA2 in resting, pre-open, and desensitized states

Katharina L Dürr et al. Cell. .

Abstract

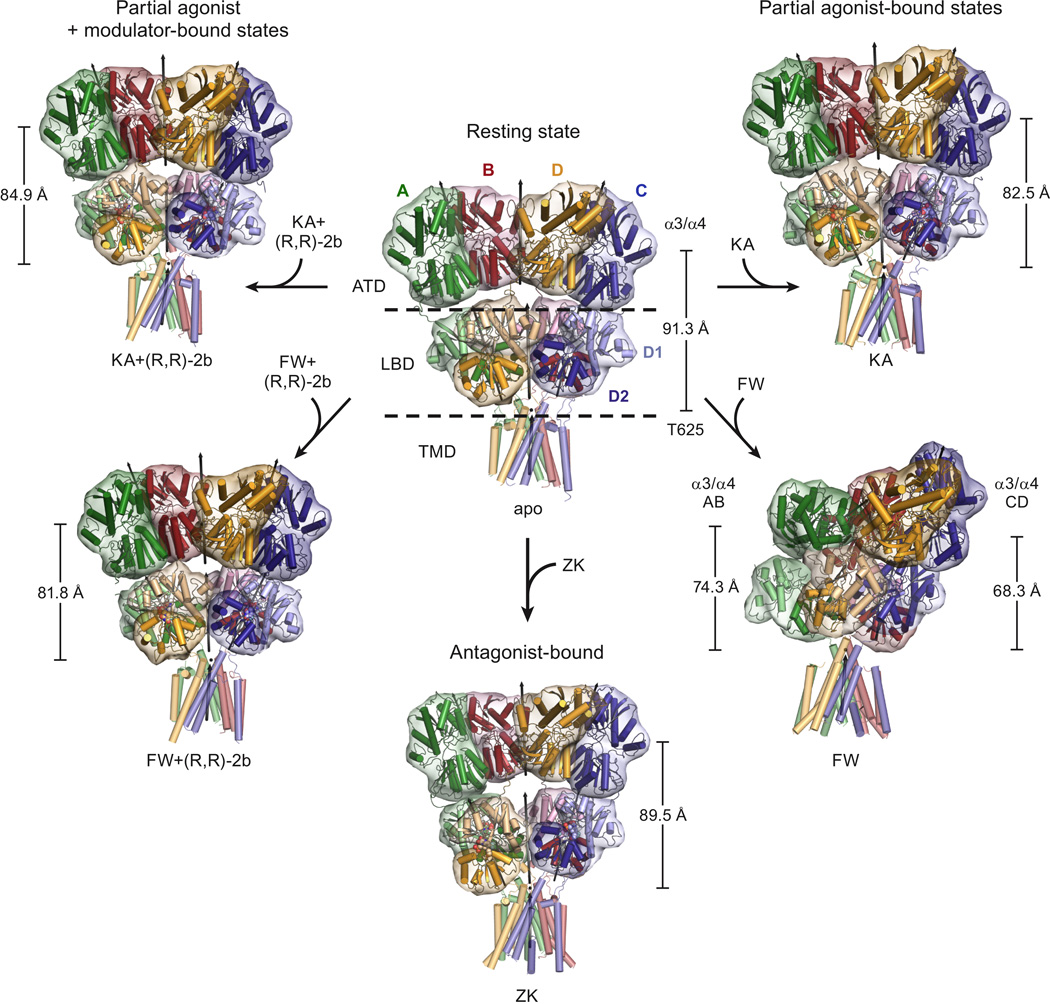
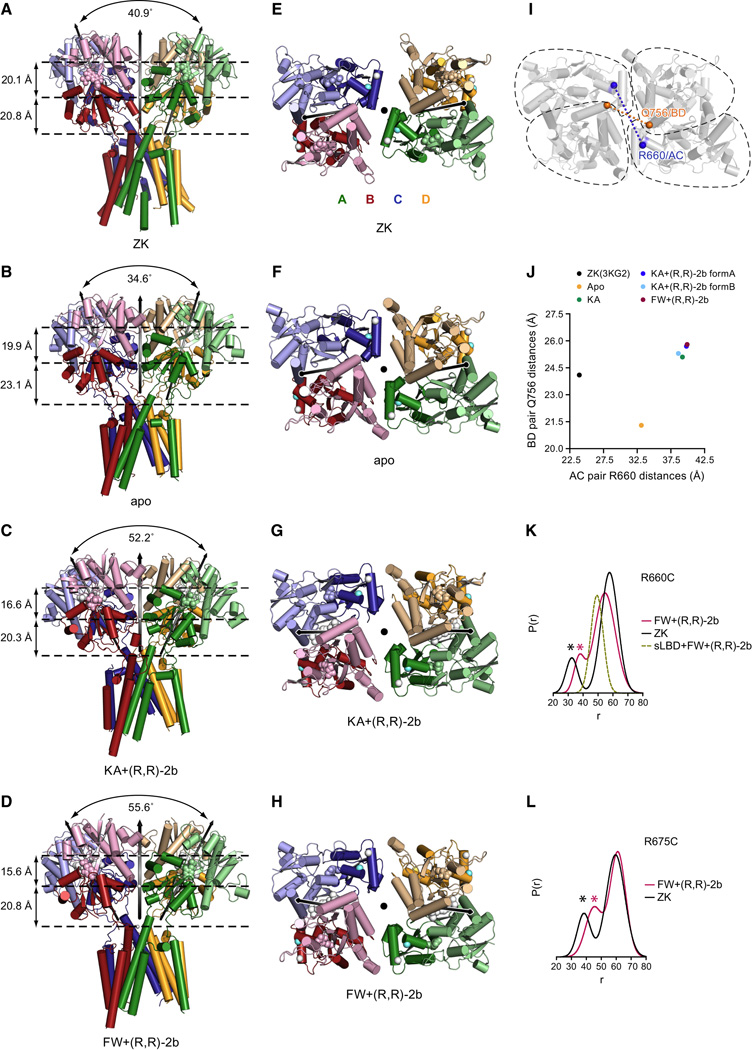
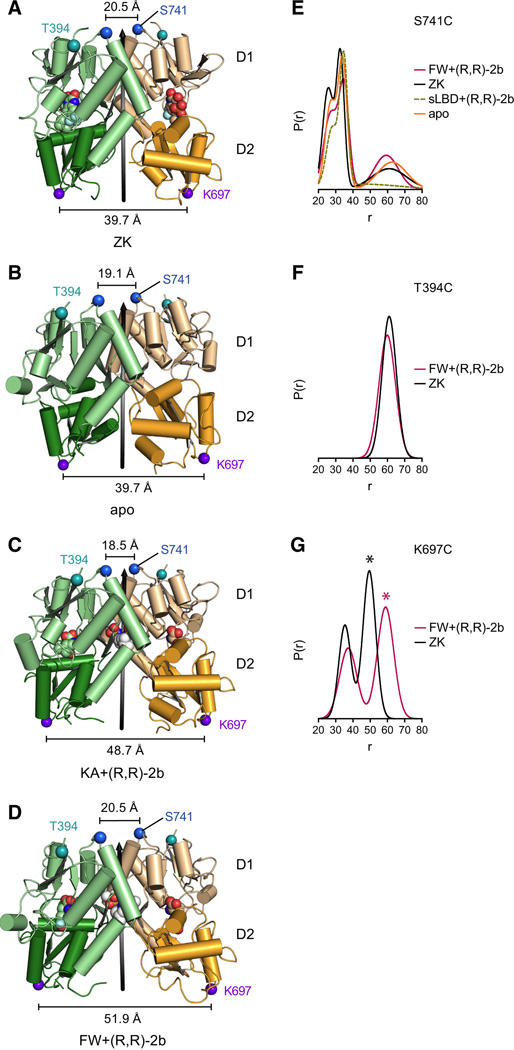
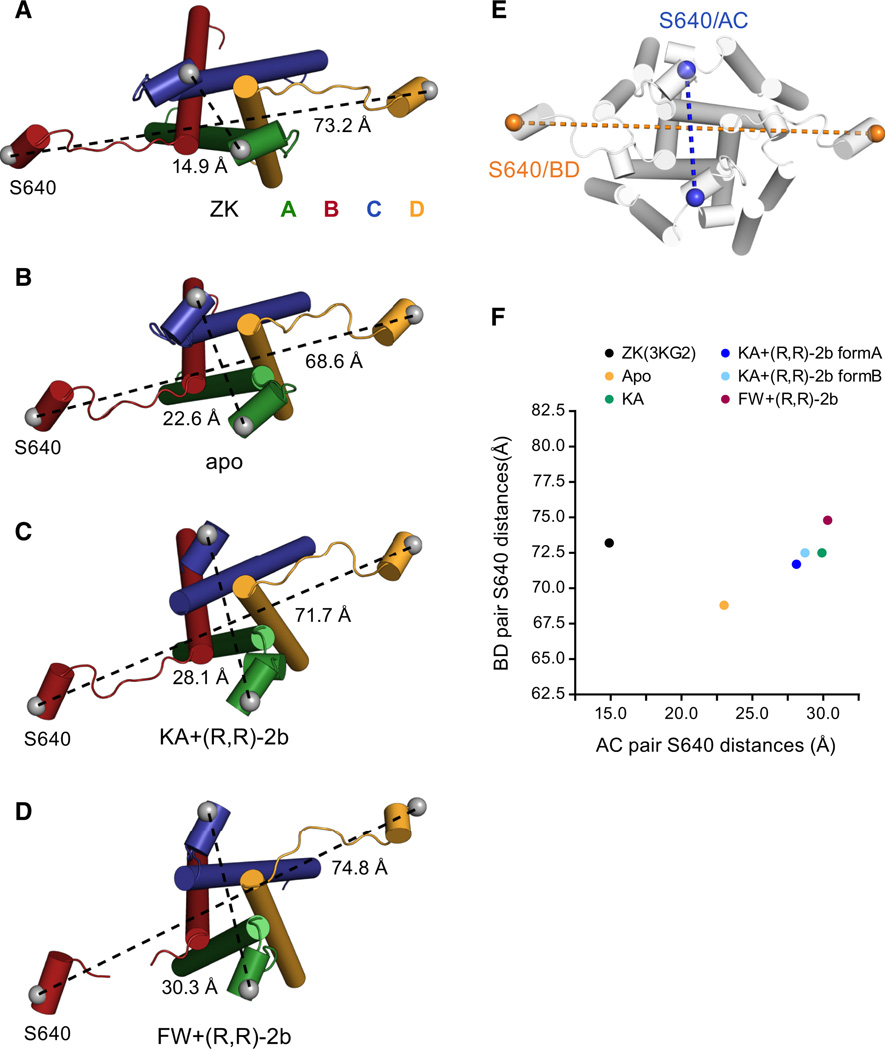
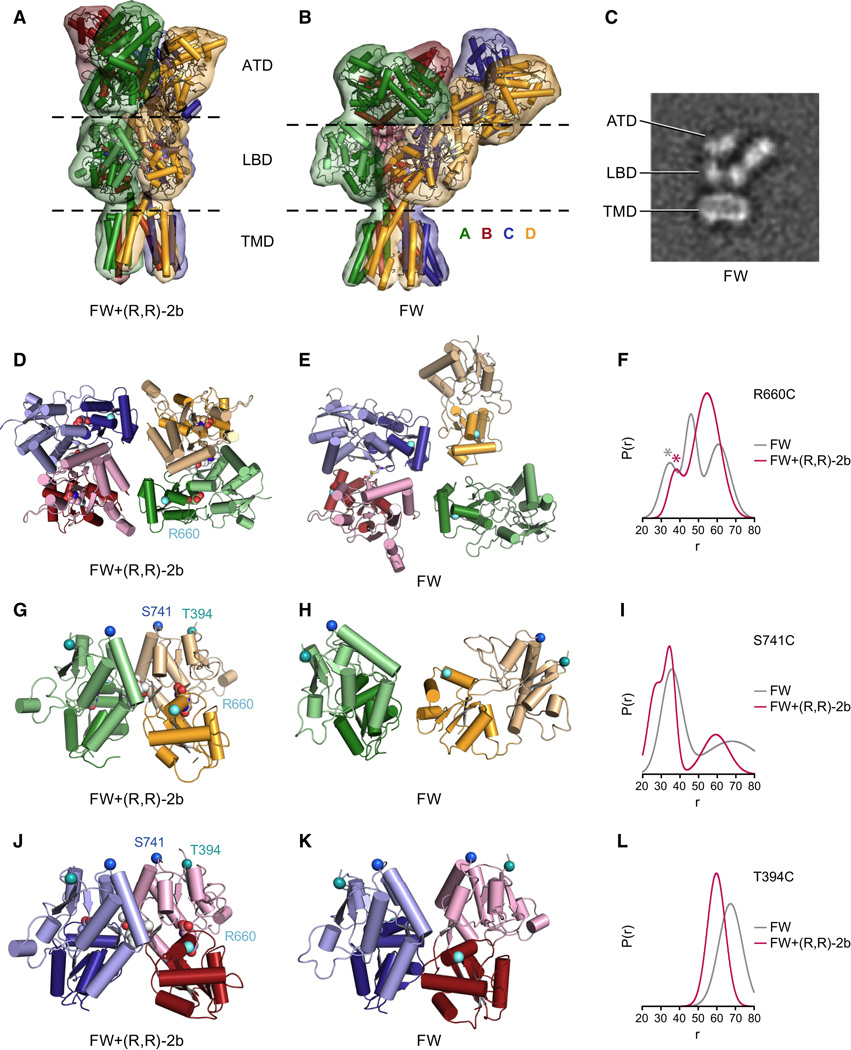
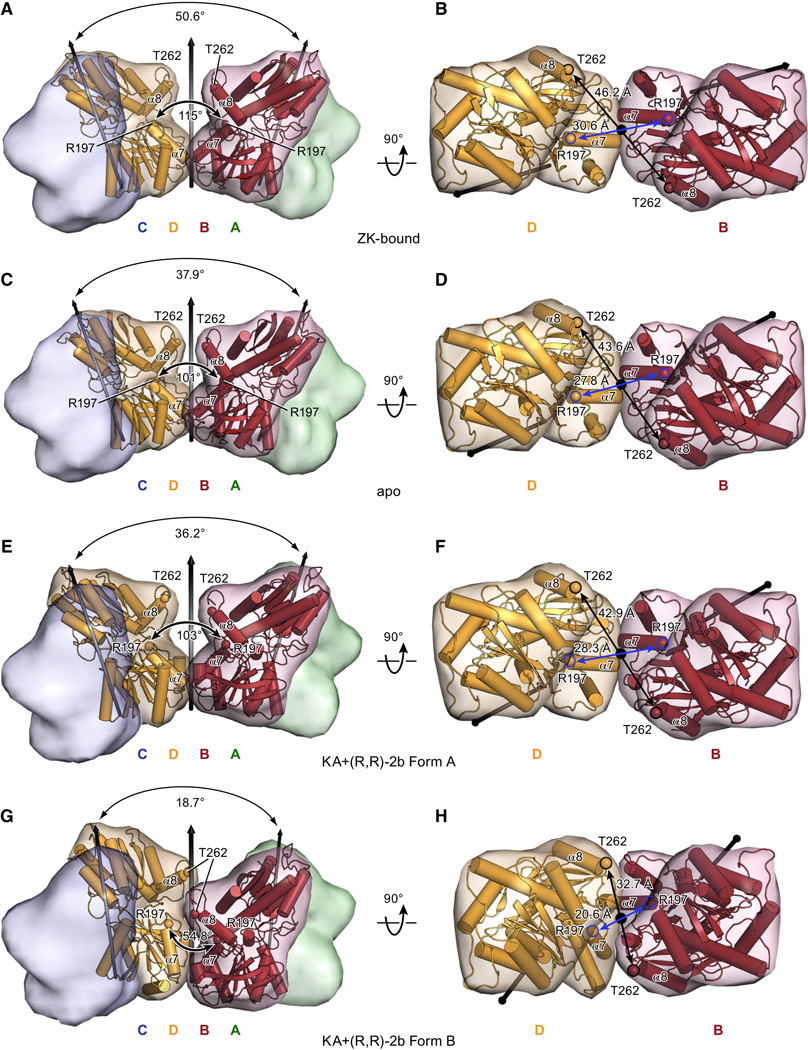
Ionotropic glutamate receptors (iGluRs) mediate the majority of fast excitatory signaling in the nervous system. Despite the profound importance of iGluRs to neurotransmission, little is known about the structures and dynamics of intact receptors in distinct functional states. Here, we elucidate the structures of the intact GluA2 AMPA receptor in an apo resting/closed state, in an activated/pre-open state bound with partial agonists and a positive allosteric modulator, and in a desensitized/closed state in complex with fluorowilliardiine. To probe the conformational properties of these states, we carried out double electron-electron resonance experiments on cysteine mutants and cryoelectron microscopy studies. We show how agonist binding modulates the conformation of the ligand-binding domain "layer" of the intact receptors and how, upon desensitization, the receptor undergoes large conformational rearrangements of the amino-terminal and ligand-binding domains. We define mechanistic principles by which to understand antagonism, activation, and desensitization in AMPA iGluRs.


Figures

Figure 1
Figure 1. Structures of intact GluR2 AMPA receptor
Views are approximately perpendicular to the overall 2-fold axes of symmetry, except for the FW-bound structure, which is oriented to match the TMD regions of the other structures. Axes of local 2-fold symmetry for the ATD and LBD dimers are indicated as black arrows. For each structure, the vertical scale bar represents the distance between the center of mass of residues Thr 625 and the center of mass of helices α3 and α4 in the ATD layer, using Cαs of all four chains. For the FW structure, the two scale bars indicate the length of the projection of this distance, calculated for the AB and CD pair individually, onto the 4-fold axis of symmetry defined by the TMD region. See also Figure S2.
Figure 2
Figure 2. Inter-domain movements of LBD ‘gating ring’
A–H. LBD layer arrangement of full-length GluR2 structures in complex with the competitive antagonist ZK (A,E; PDB code: 3KG2), in the apo state (B,F), in complex with partial agonist KA + (R,R)-2b (C, G), and in complex with partial agonist FW+(R,R)-2b (D, H). A-D. Views of the LBD layer perpendicular to the global 2-fold axes of symmetry. Angles between the local 2-fold rotation axes, shown as tilted black arrows, of LBD dimers BC and AD are indicated. Dashed lines indicate the layers defined by the positions of D1 centers of mass, D2 centers of mass and centers of mass of Thr 625 respectively. Vertical arrows on the left denote the respective distances between layers. E-H. Top down views of the LBD gating ring from the extracellular side, parallel to the overall 2-fold axes. The modulator (R,R)-2b is shown in white space-filling representation. Cα atoms of Arg 660 and Arg 675 are shown as aquamarine and white spheres, respectively. I. Same view showing the location of marker positions Arg 660 (AC pair) and Gln 756 (BD pair), whose Cα atoms were used to describe the enlargement of the central opening upon activation, with the respective distances plotted in panel J. K-L. DEER distance distributions of MTSSL-labeled GluA2 receptor constructs R660C (panel K) or R675C (panel L) measured with bound ZK (black) and FW+(R,R)-2b (magenta), respectively. DEER decays and fits are provided in Figure S3 D and, E respectively. In panel L, the distance distribution of the respective soluble MTSSL-labeled sLBD R660C construct in presence of FW+(R,R)-2b is superposed as a yellow dashed line. See also Figure S3, Table S2, Table S3, Movie M1, Movie M2, Movie M3.
Figure 3
Figure 3. Intra-dimer LBD interfaces in apo and partial agonist-bound states
A–D Side views of LBD dimers from chain A (green) and chain D (yellow) of full-length structures in complex with the competitive antagonist ZK (A; PDB code: 3KG2), in the apo state (B), in complex with partial agonist KA + modulator (R,R)-2b (C) and in complex with partial agonist FW + modulator (R,R)-2b (D). D1 domains are colored in lighter shades. LBD local 2-fold axes are shown as black arrows. Distances between Cα atoms (blue spheres) of residues Ser 741 are indicated by black scale bars. Distances between Cα atoms (purple spheres) of residues Lys 697 are indicated by black scale bars. Cα atoms of marker position T394C are shown as teal spheres. Modulator (R,R)-2b is shown in white space-filling representation. E-G. Probability distributions of DEER distances calculated from DEER decays, provided in Figure S4 E–G, of MTSSL-labeled receptor constructs S741C (E), T394C (F) and K697C (panel G) measured under apo conditions (orange), with ZK (black), or with FW+(R,R)-2b (magenta), respectively. Note that the long-distance peak of ~60 Å present under all conditions in the DEER distribution of mutant S741C (in F) is dependent on the background correction. The distance distribution of the respective MTSSL-labeled sLBD S741C construct in presence of FW+(R,R)-2b is superposed as yellow dashed line (E). The asterisk in panel G indicates putative inter-dimer distances.
Figure 4
Figure 4. Conformational ‘expansion’ of LBD-TMD linker region upon receptor activation
A–D. Top down views of the D2 (helix E) -M3 linker region of full-length structures in complex with competitive antagonist ZK (A; PDB code 3KG2), in the apo state (B), in complex with partial agonist KA+(R,R)-2b (C) and in complex with partial agonist FW+(R,R)-2b (D). E. Location of marker residue Ser 640 on helix E where Cαs are shown as orange spheres for the distal BD pair and as blue spheres for the short diagonal A/C pair, respectively. F. Plot of AC versus BD distances, measured between Cαs of Ser 640, for the indicated full-length structures, showing the increase in "pulling force" caused by the D2 separation of GluA2 receptor with partial agonists + (R,R)-2b compared to antagonist-bound and apo structures. See also Figure S4.
Figure 5
Figure 5. Conformational rearrangements upon receptor desensitization
Comparison of the non-desensitized full-length structure in complex with FW and (R,R)-2b (A,D,G,J) and low resolution X-ray (B,E,H,K) or cryo-EM (C) structures complexed with FW alone. A. X-ray structure in complex with FW+(R,R)-2b. B. Molecular replacement solution obtained from an 8.0 Å dataset collected from a crystal grown in presence of FW. C. Selected cryo-EM class average of the same receptor construct/ligand combination as in B (see Figure S5 for all class averages). The side length of the panel is 29.1 nm. D,E. View of LBD layers from the top of the receptor, Cα atoms of Arg 660 are shown as white spheres. In panel E, the disulfide link between S729C side chains in chains B and C is shown in yellow stick representation. F. Distance distributions of MTSL-labeled R660C receptor measured with FW (grey) or FW+(R,R)-2b (magenta). G,H. Side view of LBD dimer AD. Cα atoms of Ser 741 are shown as blue spheres, Cα atoms of Thr 394 are shown as teal spheres. I. Distance distributions of MTSSL-labeled S741C receptor measured with FW (grey) or FW+(R,R)-2b (magenta). J,K. Side view of LBD dimer BC. Cα atoms of Ser 741 are shown as blue spheres, Cα atoms of Thr 394 are shown as teal spheres. L. Distance distributions of MTSSL-labeled T394C receptor measured with FW (grey) or FW+(R,R)-2b (magenta). DEER decays of the shown mutants R660C, S741C and T394C are provided in Figure S5 C–E). See also Figure S5. Movie M4 and Movie M5.
Figure 6
Figure 6. ATD movements in X-ray structures under non-desensitizing conditions
Relative orientation of ATD dimers AB and CD for the ZK-bound structure (A,B), the apo structure (C,D) and the KA+(R,R)-2b-bound structures form A (E,F) or form B (G,H). Front views perpendicular to the overall 2-fold axes of symmetry (left panels A,C,E,G) and top view from the extracellular side, parallel to overall 2-fold axes, showing only subunits B and D (right panels B,D,F,H). Local and global 2-fold axes of symmetry are indicated as black arrows. Angles between the local 2-fold axes of dimer AB and CD are indicated below the larger arc, angles between α7-helices of subunits B and D are indicated below the smaller arc. Cα atoms of Thr 262 and R197 are shown as spheres. See also Figure S6.

References

    1. Adams PD, Afonine PV, Bunkoczi G, Chen VB, Echols N, Headd JJ, Hung LW, Jain S, Kapral GJ, Grosse Kunstleve RW, et al. The Phenix software for automated determination of macromolecular structures. Methods. 2011;55:94–106. - PMC - PubMed
    1. Armstrong N, Gouaux E. Mechanisms for activation and antagonism of an AMPA-sensitive glutamate receptor: crystal structures of the GluR2 ligand binding core. Neuron. 2000;28:165–181. - PubMed
    1. Armstrong N, Jasti J, Beich-Frandsen M, Gouaux E. Measurement of conformational changes accompanying desensitization in an ionotropic glutamate receptor. Cell. 2006;127:85–97. - PubMed
    1. Baconguis I, Bohlen CJ, Goehring A, Julius D, Gouaux E. X-ray structure of acid-sensing ion channel 1-snake toxin complex reveals open state of a Na(+)-selective channel. Cell. 2014;156:717–729. - PMC - PubMed
    1. Bertolino M, Baraldi M, Parenti C, Braghiroli D, DiBella M, Vicini S, Costa E. Modulation of AMPA/kainate receptors by analogues of diazoxide and cyclothiazide in thin slices of rat hippocampus. Receptors & channels. 1993;1:267–278. - PubMed

Publication types

LinkOut - more resources