

Alternatives to the six-minute walk test in pulmonary arterial hypertension
- PMID: 25111294
- PMCID: PMC4128819
- DOI: 10.1371/journal.pone.0103626
Alternatives to the six-minute walk test in pulmonary arterial hypertension
Abstract
Introduction: The physiological response during the endurance shuttle walk test (ESWT), the cycle endurance test (CET) and the incremental shuttle walk test (ISWT) remains unknown in PAH. We tested the hypothesis that endurance tests induce a near-maximal physiological demand comparable to incremental tests. We also hypothesized that differences in respiratory response during exercise would be related to the characteristics of the exercise tests.
Methods: Within two weeks, twenty-one PAH patients (mean age: 54(15) years; mean pulmonary arterial pressure: 42(12) mmHg) completed two cycling exercise tests (incremental cardiopulmonary cycling exercise test (CPET) and CET) and three field tests (ISWT, ESWT and six-minute walk test (6MWT)). Physiological parameters were continuously monitored using the same portable telemetric device.
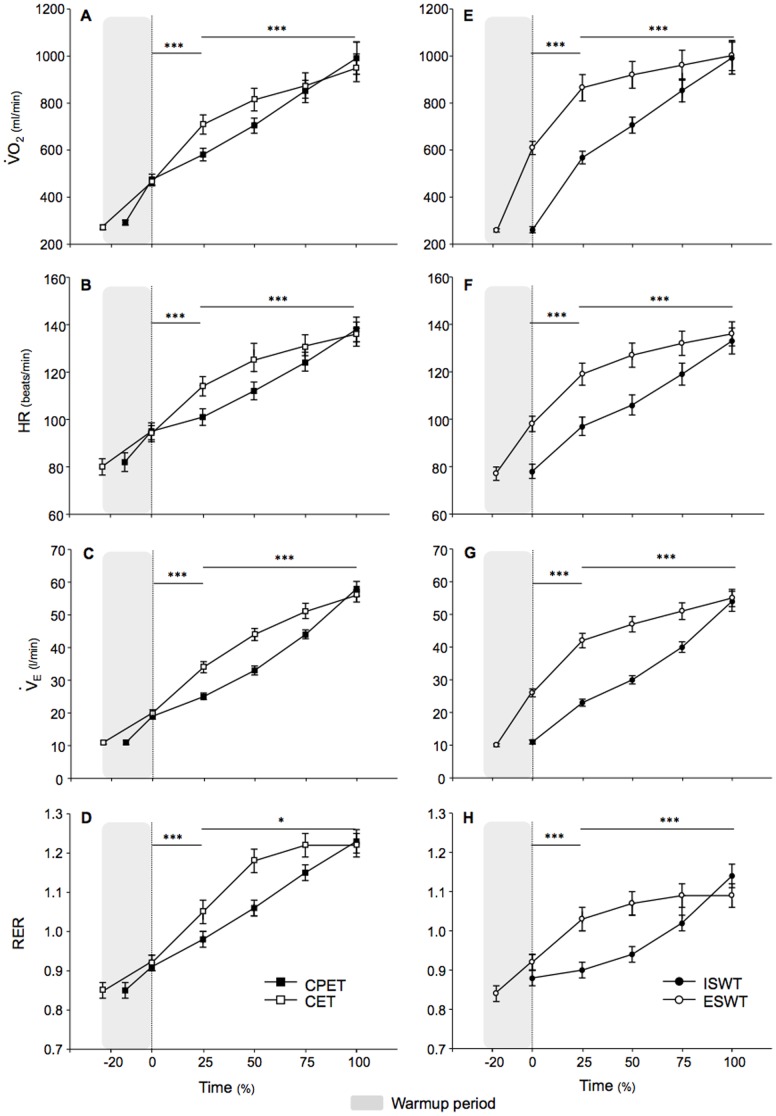
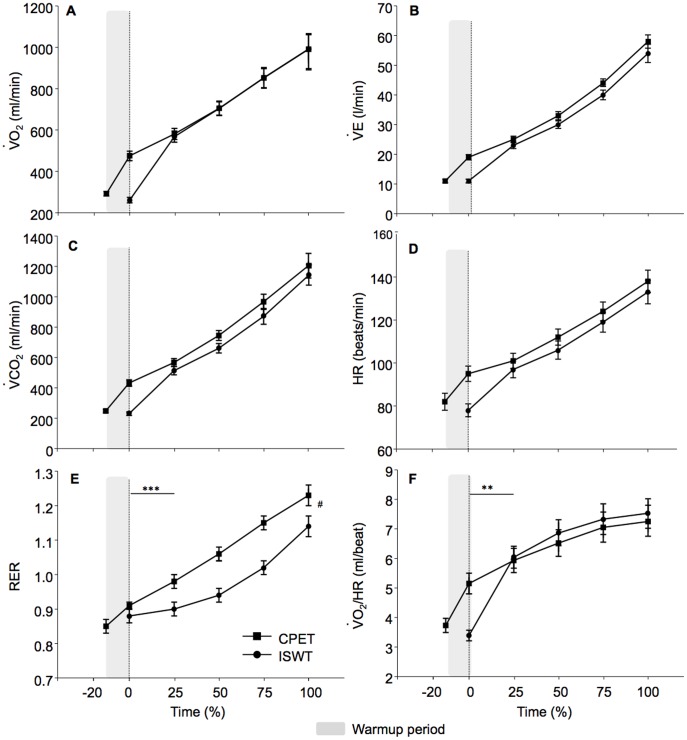
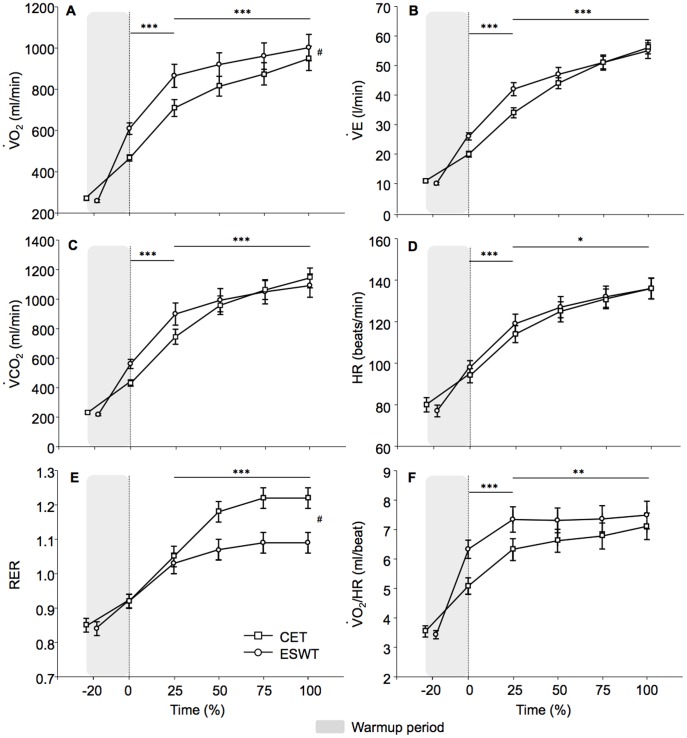
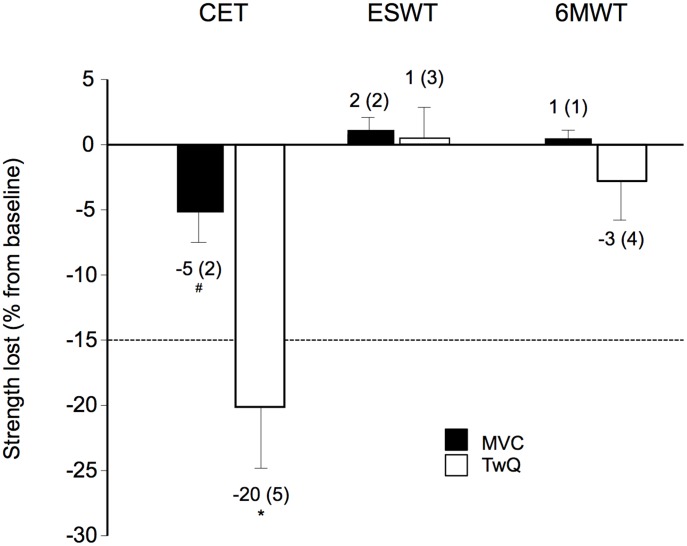
Results: Peak oxygen consumption (VO(2peak)) was similar amongst the five exercise tests (p = 0.90 by ANOVA). Walking distance correlated markedly with the VO(2peak) reached during field tests, especially when weight was taken into account. At 100% exercise, most physiological parameters were similar between incremental and endurance tests. However, the trends overtime differed. In the incremental tests, slopes for these parameters rose steadily over the entire duration of the tests, whereas in the endurance tests, slopes rose sharply from baseline to 25% of maximum exercise at which point they appeared far less steep until test end. Moreover, cycling exercise tests induced higher respiratory exchange ratio, ventilatory demand and enhanced leg fatigue measured subjectively and objectively.
Conclusion: Endurance tests induce a maximal physiological demand in PAH. Differences in peak respiratory response during exercise are related to the modality (cycling vs. walking) rather than the progression (endurance vs. incremental) of the exercise tests.
Conflict of interest statement
Figures
Similar articles
-
The endurance shuttle walk: a new field test for the assessment of endurance capacity in chronic obstructive pulmonary disease.Thorax. 1999 Mar;54(3):213-22. doi: 10.1136/thx.54.3.213. Thorax. 1999. PMID: 10325896 Free PMC article.
-
Which field walking test should be used to assess functional exercise capacity in lung cancer? An observational study.BMC Pulm Med. 2015 Aug 12;15:89. doi: 10.1186/s12890-015-0075-2. BMC Pulm Med. 2015. PMID: 26264470 Free PMC article.
-
A more effective alternative to the 6-minute walk test for the assessment of functional capacity in patients with pulmonary hypertension.Eur J Phys Rehabil Med. 2021 Aug;57(4):645-652. doi: 10.23736/S1973-9087.21.06561-8. Epub 2021 Feb 23. Eur J Phys Rehabil Med. 2021. PMID: 33619942 Clinical Trial.
-
Stronger correlation of peak oxygen uptake with distance of incremental shuttle walk test than 6-min walk test in patients with COPD: a systematic review and meta-analysis.BMC Pulm Med. 2022 Mar 24;22(1):102. doi: 10.1186/s12890-022-01897-0. BMC Pulm Med. 2022. PMID: 35331171 Free PMC article.
-
Use of exercise testing in the evaluation of interventional efficacy: an official ERS statement.Eur Respir J. 2016 Feb;47(2):429-60. doi: 10.1183/13993003.00745-2015. Epub 2016 Jan 21. Eur Respir J. 2016. PMID: 26797036 Review.
Cited by
-
The association of six-minute walk work and other clinical measures to cardiopulmonary exercise test parameters in pulmonary vascular disease.Pulm Circ. 2021 Dec 7;11(4):20458940211059055. doi: 10.1177/20458940211059055. eCollection 2021 Oct-Dec. Pulm Circ. 2021. PMID: 34917334 Free PMC article.
-
Continuous reduction in cerebral oxygenation during endurance exercise in patients with pulmonary arterial hypertension.Physiol Rep. 2020 Mar;8(6):e14389. doi: 10.14814/phy2.14389. Physiol Rep. 2020. PMID: 32189447 Free PMC article.
-
Physical Activity and Symptoms in Pulmonary Arterial Hypertension.Chest. 2016 Jul;150(1):46-56. doi: 10.1016/j.chest.2016.02.633. Epub 2016 Feb 15. Chest. 2016. PMID: 26892602 Free PMC article.
-
Cross-Validation of Predictive Equation for Cardiorespiratory Fitness by Modified Shuttle Walk Test in Adults with Schizophrenia: A Secondary Analysis of the CORTEX-SP Study.Int J Environ Res Public Health. 2021 Oct 29;18(21):11390. doi: 10.3390/ijerph182111390. Int J Environ Res Public Health. 2021. PMID: 34769904 Free PMC article.
References
-
- Rubin LJ (1997) Primary pulmonary hypertension. NEnglJMed 336: 111–117. - PubMed
-
- D'Alonzo GE, Gianotti LA, Pohil RL, Reagle RR, DuRee SL, et al. (1987) Comparison of progressive exercise performance of normal subjects and patients with primary pulmonary hypertension. Chest 92: 57–62. - PubMed
-
- Riley MS, Porszasz J, Engelen MP, Brundage BH, Wasserman K (2000) Gas exchange responses to continuous incremental cycle ergometry exercise in primary pulmonary hypertension in humans. EurJApplPhysiol 83: 63–70. - PubMed
-
- Sun XG, Hansen JE, Oudiz RJ, Wasserman K (2001) Exercise pathophysiology in patients with primary pulmonary hypertension. Circulation 104: 429–435. - PubMed
-
- Mainguy V, Maltais F, Saey D, Gagnon P, Martel S, et al. (2010) Peripheral muscle dysfunction in idiopathic pulmonary arterial hypertension. Thorax 65: 113–117. - PubMed
Publication types
MeSH terms
LinkOut - more resources
Full Text Sources
Other Literature Sources
Medical
