. 2014 Aug 11;9(8):e104241.
doi: 10.1371/journal.pone.0104241. eCollection 2014.

Population genomics of the fission yeast Schizosaccharomyces pombe

Affiliations

Population genomics of the fission yeast Schizosaccharomyces pombe

Jeffrey A Fawcett et al. PLoS One. .

Abstract

The fission yeast Schizosaccharomyces pombe has been widely used as a model eukaryote to study a diverse range of biological processes. However, population genetic studies of this species have been limited to date, and we know very little about the evolutionary processes and selective pressures that are shaping its genome. Here, we sequenced the genomes of 32 worldwide S. pombe strains and examined the pattern of polymorphisms across their genomes. In addition to introns and untranslated regions (UTRs), intergenic regions also exhibited lower levels of nucleotide diversity than synonymous sites, suggesting that a considerable amount of noncoding DNA is under selective constraint and thus likely to be functional. A number of genomic regions showed a reduction of nucleotide diversity probably caused by selective sweeps. We also identified a region close to the end of chromosome 3 where an extremely high level of divergence was observed between 5 of the 32 strains and the remain 27, possibly due to introgression, strong positive selection, or that region being responsible for reproductive isolation. Our study should serve as an important starting point in using a population genomics approach to further elucidate the biology of this important model organism.


Conflict of interest statement

Competing Interests: The authors have declared that no competing interests exist.

Figures

Figure 1
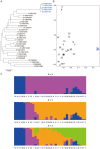
Figure 1. Population structure of S. pombe.
Neighbor-joining tree (a) and the results of principal component analysis (PCA) (b) and the program STRUCTURE (c). The numbers of the strains correspond to those in Table 1. The 5 samples that strongly cluster together are colored in blue. The results of STRUCTURE with K = 4 changes when different subsets of randomly chosen SNPs are used, and the result of K = 4 shown here represents one example. The grouping of strains 15, 16, 17, 18, and 30, and the grouping of strains 2, 9, 32, and 1 are both always observed. The results of K = 2 and K = 3 are consistent.
Figure 2
Figure 2. Minor allele frequency spectrum.
The frequencies of all sites, nonsynonymous sites, and synonymous sites are shown in blue, green, and yellow, respectively.
Figure 3
Figure 3. Histogram of .
Only genes where more than 200 synonymous sites could be analyzed are included. Four genes with formula image ratios of formula image are also not shown.
Figure 4
Figure 4. The decay of linkage disequilibrium with distance between SNPs.
formula image is plotted as a function of distance in kilobase up to 500 kb. The average formula image values over each non-overlapping 1 kb bin are shown.
Figure 5
Figure 5. Genome-wide distribution of nucleotide diversity and Tajima's D.
The values were calculated for each sliding window of 20 kb with an increment of 4 kb. The putative selective sweep region on chromosome 1 with low nucleotide diversity and low Tajima's D is indicated by a blue downward triangle. The mating locus region on chromosome 2 and another region on chromosome 3 showing high nucleotide diversity are indicated by red downward triangles. The gray shaded regions correspond to centromeric regions.
Figure 6
Figure 6. Two examples of putative partial sweep events on chromosomes 1 and 2.
The NJ trees shown on the left are the same as in Figure 1a. The strains in red share long haplotypes. Distributions of the nucleotide diversity around the long haplotypes based on a sliding window of 10 kb with a 2 kb increment are shown on the right. Black and red lines represent the nucleotide diversity of all individuals and the nucleotide diversity of the subsamples sharing the haplotypes, respectively.
Figure 7
Figure 7. Pattern of SNPs in a region near the end of chromosome 3 showing extremely high nucleotide diversity.
The NJ tree shown on the left is the same as in Figure 1a. The 5 strains that are highly diverged from the remaining 27 are indicated by blue. The distribution of the nucleotide divergence between the 5 strains and the remaining 27 (red), as well as the nucleotide diversity within the 27 strains as a control (black) based on a sliding window of 200 bp with 40 bp overlap are shown on the right. Annotated features in the region such as protein-coding genes, noncoding RNAs, and transposable elements are shown above by dark red, dark blue, and green rectangles, respectively. Protein-coding regions within the protein-coding genes are indicated by filled rectangles. The gray shaded regions are those masked in our analysis. The region where the divergence is drastically elevated is boxed in red. Gene trees corresponding to two alternative scenarios that could account for the observed elevated divergence are illustrated below.

References

    1. Ganley ARD, Hayashi K, Horiuchi T, Kobayashi T (2005) Identifying gene-independent noncoding functional elements in the yeast ribosomal DNA by phylogenetic footprinting. Proc Natl Acad Sci U S A 102: 11787–11792. - PMC - PubMed
    1. Allshire RC, Karpen GH (2008) Epigenetic regulation of centromeric chromatin: old dogs, new tricks? Nat Rev Genet 9: 923–937. - PMC - PubMed
    1. Phadnis N, Hyppa RW, Smith GR (2011) New and old ways to control meiotic recombination. Trends Genet 27: 411–421. - PMC - PubMed
    1. Goto DB, Nakayama J (2012) RNA and epigenetic silencing: insight from fission yeast. Dev Growth Differ 54: 129–141. - PMC - PubMed
    1. Nurse P (1990) Universal control mechanism regulating onset of M-phase. Nature 344: 503–508. - PubMed

Publication types

LinkOut - more resources