. 2014 Nov 15;102 Pt 2(0 2):393-406.
doi: 10.1016/j.neuroimage.2014.08.004. Epub 2014 Aug 8.

Optical Coherence Tomography angiography reveals laminar microvascular hemodynamics in the rat somatosensory cortex during activation

Affiliations

Optical Coherence Tomography angiography reveals laminar microvascular hemodynamics in the rat somatosensory cortex during activation

Vivek J Srinivasan et al. Neuroimage. .

Abstract

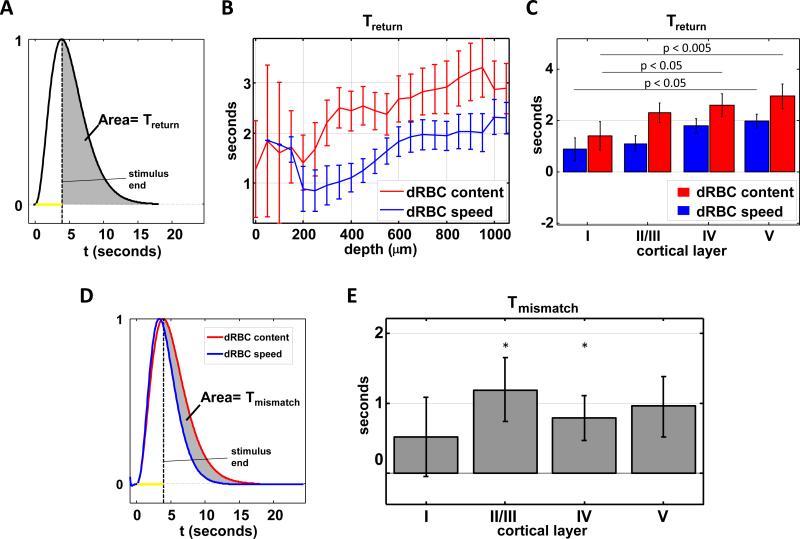
The BOLD (blood-oxygen-level dependent) fMRI (functional Magnetic Resonance Imaging) signal is shaped, in part, by changes in red blood cell (RBC) content and flow across vascular compartments over time. These complex dynamics have been challenging to characterize directly due to a lack of appropriate imaging modalities. In this study, making use of infrared light scattering from RBCs, depth-resolved Optical Coherence Tomography (OCT) angiography was applied to image laminar functional hyperemia in the rat somatosensory cortex. After defining and validating depth-specific metrics for changes in RBC content and speed, laminar hemodynamic responses in microvasculature up to cortical depths of >1mm were measured during a forepaw stimulus. The results provide a comprehensive picture of when and where changes in RBC content and speed occur during and immediately following cortical activation. In summary, the earliest and largest microvascular RBC content changes occurred in the middle cortical layers, while post-stimulus undershoots were most prominent superficially. These laminar variations in positive and negative responses paralleled known distributions of excitatory and inhibitory synapses, suggesting neuronal underpinnings. Additionally, the RBC speed response consistently returned to baseline more promptly than RBC content after the stimulus across cortical layers, supporting a "flow-volume mismatch" of hemodynamic origin.

Keywords: Blood volume; Blood-oxygen-level-dependent; Forepaw; Hematocrit; Hemodynamics; Laminar; Neurovascular coupling; Optical Coherence Tomography; Scattering; Somatosensory cortex; Three-dimensional microscopy; functional Magnetic Resonance Imaging.


Figures

Figure 1
Figure 1
OCT angiography increases specificity for dynamic scattering from moving blood cells. (A) A photograph of the craniotomy under green light, showing the location of repeated OCT scans. (B) Conventional OCT intensity image includes all scattering from brain tissue, including the extravascular space. A complex filtering method was used to isolate dynamic signal intensity (C) and static signal intensity (D), as described in the Appendix. The enhancement of a vascular region in (C) and the suppression of a vascular region in (D) relative to (B) are highlighted by a white arrow. (E) Physical model for multiple scattering tails in dynamic signal intensity includes extravascular backscattering and RBC forward scattering. (F) Color-coded angiogram, with superficial vasculature colored orange/yellow and deep vasculature colored green.
Figure 2
Figure 2
OCT performs imaging of dRBC content and speed. Photograph of rat somatosensory cortex with angiogram showing surface vessels colored in yellow / orange and deep vessels colored in green. A single OCT scan is shown as a white line across the angiogram. (C-D) Dynamic intensity image (Id), which shows dynamic signal from blood cell components, and static scattering image (Is), which shows signal from other tissue. (E) OISI peak activation map (4-6 seconds post-stimulus onset) of logarithmic reflectance changes at an isobestic wavelength of 570 nm, proportional to changes in total hemoglobin with a negative constant of proportionality. OCT metrics of attenuation coefficient (F-G), dRBC content (H), and dRBC speed (I, mean of 16 vessels +/− s.d.) are shown (see Appendix and Supplementary Figure 6 for further description of metrics) at peak activation. (J) When metrics are determined from comparable cortical regions, differing kinetics imply different hemodynamic underpinnings. Particularly, the attenuation coefficient and dRBC content agree with OISI reflectance changes (averaged over solid line in E), whereas dRBC speed returns to baseline more promptly after stimulus cessation. Based on the well-accepted correspondence of reflectance at an isosbestic wavelength and hemoglobin content, we conclude that the dRBC content metric closely tracks changes in hemoglobin via RBC backscattering, and is minimally sensitive to speed.
Figure 3
Figure 3
Hemoglobin kinetics match OCT attenuation coefficient and dRBC content, but not dRBC speed. Deconvolved OISI (A, 570 nm) and OCT responses (B-D) to event-related stimulus paradigm with 1-5 Hz frequencies. (E-G) Parametric plots of OCT metrics (averaged over the first 500 microns, corresponding to the OISI depth) versus OISI reflectance for the data in A-D. OCT responses were convolved with a sliding window corresponding to the CCD integration time (~1 s). OCT attenuation coefficient and dRBC content time courses closely match those of hemoglobin absorption (E-F). By contrast, the OCT dynamic signal bandwidth, theoretically related to speed, exhibits significantly faster kinetics than hemoglobin absorption (G, dotted arrows show progression of time), particularly in the return to baseline and undershoot. A least squares linear fit to the data in E-G is shown in black. (H) R2 values, determined from parametric plots (N=4, mean +/− s.e.m.), are higher for the attenuation coefficient and dRBC content metrics, suggesting that these metrics are biophysically linked more closely to hemoglobin content than dRBC speed. To determine p-values, ANOVA was performed on the z-scores obtained by Fisher transformation followed by Tukey's honestly significant differences test.
Figure 4
Figure 4
Single trial imaging of laminar dRBC response characteristics in an individual subject. (A) OCT angiogram with scan location as a line. Dynamic (B) and static (C) signal intensity images. (D) Normalized OCT intensity shows a response to individual stimuli (3 Hz, 4 s) over the boxed region of interest shown in B-C. (E) OCT responses to individual stimulus trains are observable. (F) Calculation of onset time, time to half peak, and time to peak from normalized response. (G-K) Average fractional change, peak fractional change, time to peak, time to half peak, and onset time, plotted as mean ± s.e.m across 12 trials.
Figure 5
Figure 5
Trends in laminar dRBC response characteristics across animals. Responses were obtained from a run of 12 trials (3 Hz, 4 second stimuli, 21 seconds ISI). Un-normalized (A) and normalized (B) responses from a single animal, with depth color-coded from blue (more superficial) to red (more deep). Responses are shown in false color vs. depth and time (C), and as a surface plot (D). (E-I) Laminar profiles for average fractional change, peak fractional change, time to peak, and time to half peak, and onset time, pooled over all animals (N = 15, mean +/− s.e.m.), are shown. Timing for dRBC speed was not explicitly investigated due to lower signal-to-noise ratios.
Figure 6
Figure 6
(A) Based on in vivo OCM imaging of cytoarchitecture, cortical layer depth ranges were defined and laminar data were grouped accordingly. Normalized time-averaged and peak fractional changes (B-C, after division by max vs. depth) and time to peak, time to half peak, and onset time (D-F, after subtraction of min vs. depth), are shown as bar plots (N = 15, mean +/−s.e.m.), showing that the largest and earliest hemodynamic responses occur in middle cortical layers. Before averaging across runs and animals, the minimum time across depths greater than 200 microns was subtracted from each individual time profile. The p-values were calculated by one-way ANOVA followed by Tukey's honestly significant differences test for comparisons between layers, and only comparisons with p < 0.05 are shown. Speed showed very similar laminar trends to dRBC content (data not shown).
Figure 7
Figure 7
The undershoot ratio increases near the cortical surface. (A) OISI peak activation map (4-6 seconds post-stimulus onset) of logarithmic reflectance changes at an isobestic wavelength of 570 nm showing 2 locations with different response characteristics, i.e. different undershoot ratios (inset in A, defined as the area of the negative lobe of the response divided by the area of the positive lobe of the response). OCT dRBC content traces (dashed lines) were determined over a region of 500 microns corresponding approximately to the OISI penetration depth. (B) The undershoot ratio map based on OISI shows that region 1 (surround) return to baseline earlier and undershoots relatively more than region 2 (center). Un-normalized (C-D) and normalized (E) dynamic red blood cell (RBC) content response time courses near region 1, when plotted versus depth, show increased superficial undershoot. When trials across multiple animals that exhibited significant undershoots (>10% at any depth) were investigated, deeper layers were found to have smaller undershoot ratios (F). Comparisons across runs and animals was performed after division by the maximum undershoot ratio at depths greater than 200 microns (N = 14). Significance values are calculated by one-way ANOVA followed by Tukey's honestly significant differences test. (G) Whereas the response mean and peak show a maximum in the middle cortical layers, the superficial cortical layers show a larger relative undershoot ratio. Speed undershoot ratios showed similar laminar trends to dRBC content undershoot ratios (data not shown).
Figure 8
Figure 8
A robust mismatch between dRBC content and speed across cortical layers was observed. (A) The return time was calculated as the area under the normalized response, starting from the stimulus end. (B) Both dRBC content and speed show increased return times with increasing cortical depth (N=7, mean +/− s.e.m.). The faster superficial return times are in agreement with the larger superficial undershoot ratios (Figure 7). Critically, dRBC speed consistently returned to baseline more rapidly than dRBC content across the cortical depths (B) and cortical layers (C). Significant differences, determined by one-way ANOVA followed by Tukey's honestly significant differences test, after subtraction of the minimum return time at depths greater than 200 microns for each run, are shown. (E) The mismatch time, determined as shown in (D), was found to be greater than zero across cortical layers and was statistically significant in layers II-IV (N=7, *p<0.05, two-tailed Student's t-test).

Similar articles

Cited by

References

    1. Avermann M, Tomm C, Mateo C, Gerstner W, Petersen CC. Microcircuits of excitatory and inhibitory neurons in layer 2/3 of mouse barrel cortex. J Neurophysiol. 2012;107:3116–3134. - PubMed
    1. Blinder P, Tsai PS, Kaufhold JP, Knutsen PM, Suhl H, Kleinfeld D. The cortical angiome: an interconnected vascular network with noncolumnar patterns of blood flow. Nat Neurosci. 2013;16:889–897. - PMC - PubMed
    1. Buxton RB. The elusive initial dip. Neuroimage. 2001;13:953–958. - PubMed
    1. Cauli B, Tong XK, Rancillac A, Serluca N, Lambolez B, Rossier J, Hamel E. Cortical GABA interneurons in neurovascular coupling: relays for subcortical vasoactive pathways. J Neurosci. 2004;24:8940–8949. - PMC - PubMed
    1. Chaigneau E, Oheim M, Audinat E, Charpak S. Two-photon imaging of capillary blood flow in olfactory bulb glomeruli. Proc Natl Acad Sci U S A. 2003;100:13081–13086. - PMC - PubMed

Publication types

LinkOut - more resources