. 2014 Nov 1:101:765-77.
doi: 10.1016/j.neuroimage.2014.08.002. Epub 2014 Aug 8.

Guiding functional connectivity estimation by structural connectivity in MEG: an application to discrimination of conditions of mild cognitive impairment

Affiliations

Guiding functional connectivity estimation by structural connectivity in MEG: an application to discrimination of conditions of mild cognitive impairment

José Angel Pineda-Pardo et al. Neuroimage. .

Abstract

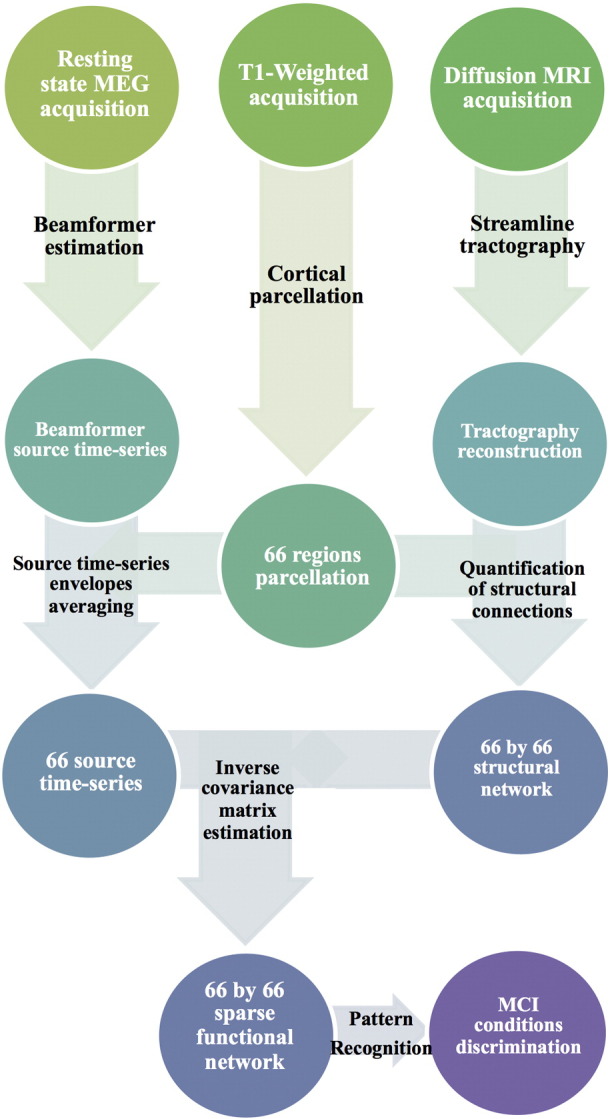
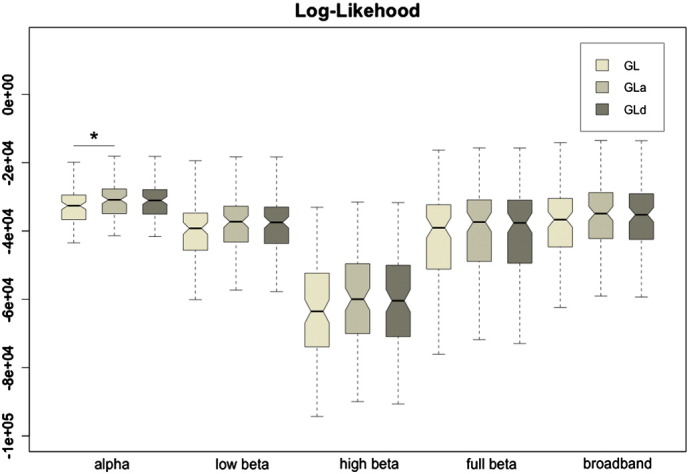
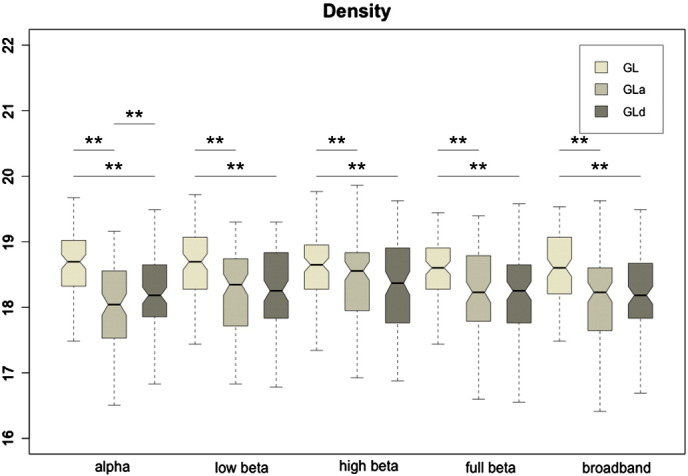
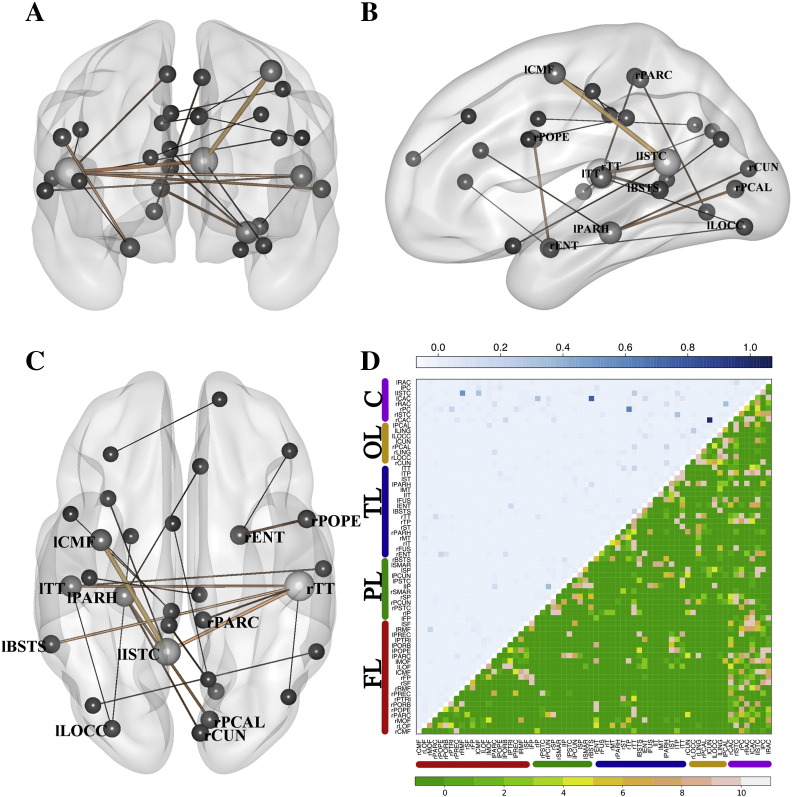
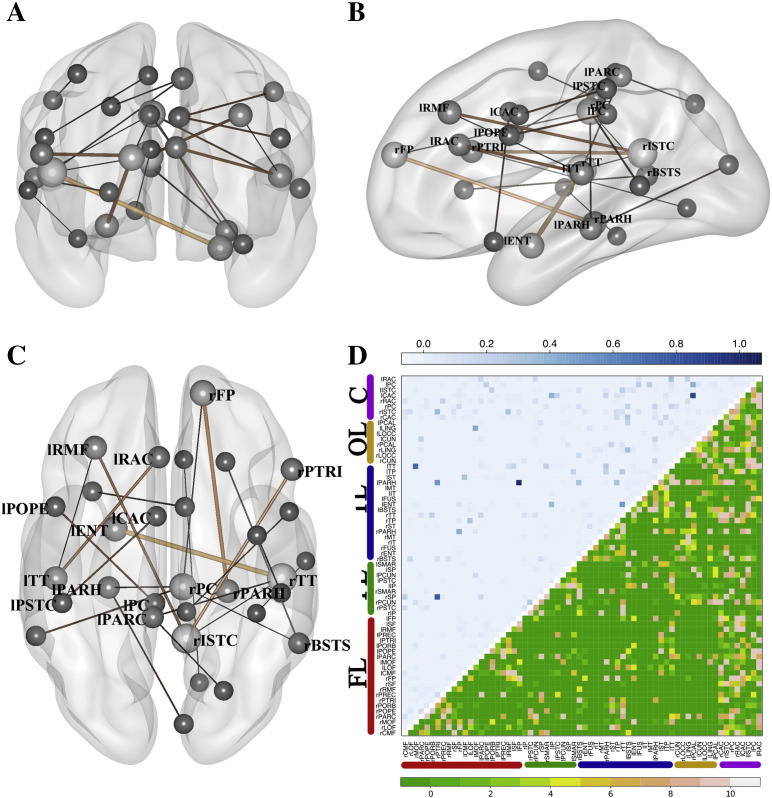
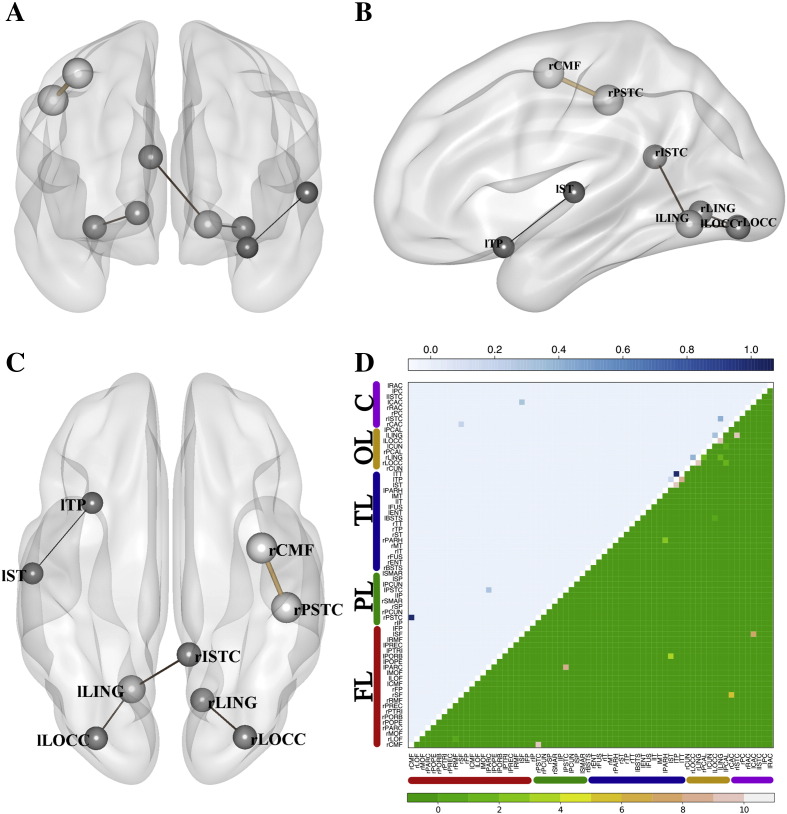
Whole brain resting state connectivity is a promising biomarker that might help to obtain an early diagnosis in many neurological diseases, such as dementia. Inferring resting-state connectivity is often based on correlations, which are sensitive to indirect connections, leading to an inaccurate representation of the real backbone of the network. The precision matrix is a better representation for whole brain connectivity, as it considers only direct connections. The network structure can be estimated using the graphical lasso (GL), which achieves sparsity through l1-regularization on the precision matrix. In this paper, we propose a structural connectivity adaptive version of the GL, where weaker anatomical connections are represented as stronger penalties on the corresponding functional connections. We applied beamformer source reconstruction to the resting state MEG recordings of 81 subjects, where 29 were healthy controls, 22 were single-domain amnestic Mild Cognitive Impaired (MCI), and 30 were multiple-domain amnestic MCI. An atlas-based anatomical parcellation of 66 regions was obtained for each subject, and time series were assigned to each of the regions. The fiber densities between the regions, obtained with deterministic tractography from diffusion-weighted MRI, were used to define the anatomical connectivity. Precision matrices were obtained with the region specific time series in five different frequency bands. We compared our method with the traditional GL and a functional adaptive version of the GL, in terms of log-likelihood and classification accuracies between the three groups. We conclude that introducing an anatomical prior improves the expressivity of the model and, in most cases, leads to a better classification between groups.

Keywords: Diffusion tensor imaging; Graphical Lasso; Machine learning; Magnetoencephalography; Mild cognitive impairment; Multimodal neuroimaging; Multivariate sparse regression; Resting state.


Figures

Fig. 1
Fig. 1
Flow-chart diagram describing the processing pipeline of the study, from the acquisition of MEG and MRI data to the statistical discrimination between healthy controls and MCI groups.
Fig. 2
Fig. 2
Boxplots of the log-likelihood values for the three graphical lasso approaches: GL, GLa and GLd. The asterisk indicates that the distributions differ with significance p < 0.05 after paired t-test statistical comparison.
Fig. 3
Fig. 3
Boxplots of the density values for the three implemented graphical lasso approaches: GL, GLa and GLd. The double asterisk indicates that the distributions differ with significance p < 0.05 after paired t-test statistical comparison, and survived a False Discovery Rate multiple comparisons correction (qFDR < 0.05).
Fig. 4
Fig. 4
Selected features in the LDA classifier for HC-sdMCI for the broadband and GLd (accuracy 86.27%). A–C panels represent three views (sagittal, coronal and axial) of the selected links. The width and color (black to soft brown) of these links grows proportional to the median of the weights assigned to the links by the classifier across the ten folds of the cross-validation testing procedure. The size of the ball that represents the node is proportional to the number of links converging at this node. In panel D, the upper triangular matrix shows the median of the assigned weights and the lower triangular matrix represents the number of folds in which a specific link has been selected. The nodes were grouped according to brain lobes: FL – Frontal Lobe; PL – Parietal Lobe; TL – Temporal Lobe; OL – Occipital Lobe; C – Cingulate Cortex. See Supplementary Table 2 for a ranking of the links with the highest weights.
Fig. 5
Fig. 5
Selected features in the LDA classifier for HC-mdMCI in the full beta band for GLd (accuracy 81.36%). A–C panels are represent three views (sagittal, coronal and axial) of the selected links. The width and color (black to soft brown) of these links grows proportional to the median of the weights assigned to the links by the classifier across the 10-fold of the cross-validation testing procedure. The size of the ball that represents the node is proportional to the number of links converging at it. In panel D, the upper triangular matrix shows the median of the assigned weights and in the lower triangular matrix represents the number of folds in which a specific link has been selected. The nodes were grouped according to brain lobes: FL – Frontal Lobe; PL – Parietal Lobe; TL – Temporal Lobe; OL – Occipital Lobe; C – Cingulate Cortex. See Supplementary Table 2 for a ranking of the links with the highest weights.
Fig. 6
Fig. 6
Selected features in the LDA classifier for sdMCI-mdMCI in broadband and with GL (accuracy 84.62%). Panels A-C represent three views (sagittal, coronal and axial) of the selected links. The width and color (black to soft brown) of these links grows proportional to the median of the weights assigned to the links by the classifier across the 10-fold of the cross-validation testing procedure. The size of the ball that represents the node is proportional to the number of links converging at it. In panel D, the upper triangular matrix shows the median of the assigned weights and the lower triangular matrix represents the number of folds in which a specific link has been selected. The nodes were grouped according to brain lobes: FL – Frontal Lobe; PL – Parietal Lobe; TL – Temporal Lobe; OL – Occipital Lobe; C – Cingulate Cortex. See Supplementary Table 2 for a ranking of the links with the highest weights.

Similar articles

Cited by

References

    1. Atluri G., Padmanabhan K., Fang G., Steinbach M., Petrella J.R., Lim K., Macdonald A., Samatova N.F., Doraiswamy P.M., Kumar V. Complex biomarker discovery in neuroimaging data: Finding a needle in a haystack. NeuroImage Clin. 2013;3:123–131. - PMC - PubMed
    1. Auer S., Reisberg B. The GDS/FAST staging system. Int. Psychogeriatr. 1997;9(Suppl. 1):167–171. - PubMed
    1. Bajo R., Maestú F., Nevado A., Sancho M., Gutiérrez R., Campo P., Castellanos N.P., Gil P., Moratti S., Pereda E., Del-Pozo F. Functional connectivity in mild cognitive impairment during a memory task: implications for the disconnection hypothesis. J. Alzheimers Dis. 2010;22:183–193. - PubMed
    1. Bajo R., Castellanos N.P., Cuesta P., Aurtenetxe S., Garcia-Prieto J., Gil-Gregorio P., del-Pozo F., Maestu F. Differential patterns of connectivity in progressive mild cognitive impairment. Brain Connect. 2012;2:21–24. - PubMed
    1. Baker A.P., Brookes M.J., Redek I.A., Smith S.S., Behrens T., Probert Smith P.J., Woolrich M.W. Fast transient networks in spontaneous human brain activity. Elife. 2014;3:e01867. - PMC - PubMed

Publication types