

A contact-imaging based microfluidic cytometer with machine-learning for single-frame super-resolution processing
- PMID: 25111497
- PMCID: PMC4128713
- DOI: 10.1371/journal.pone.0104539
A contact-imaging based microfluidic cytometer with machine-learning for single-frame super-resolution processing
Abstract
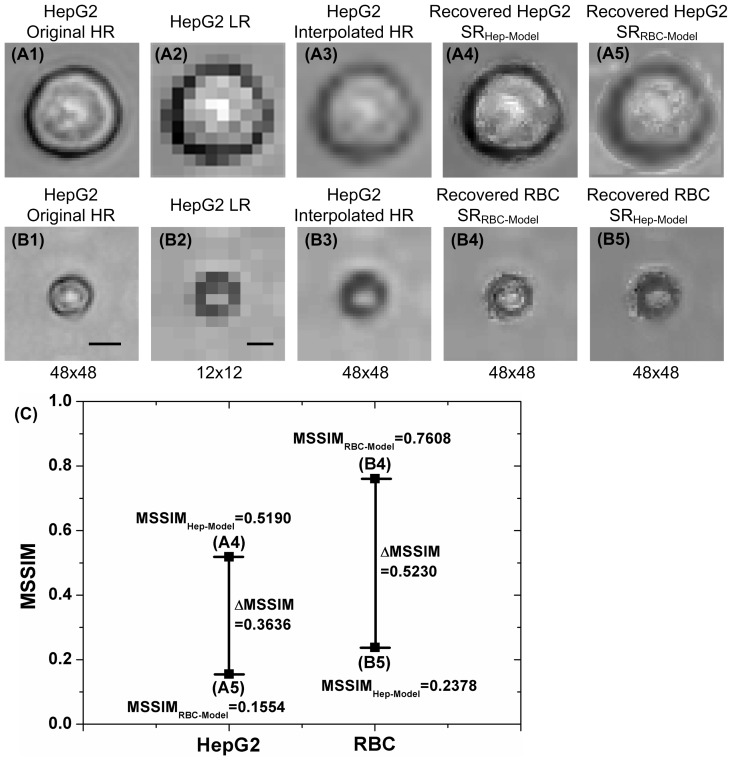
Lensless microfluidic imaging with super-resolution processing has become a promising solution to miniaturize the conventional flow cytometer for point-of-care applications. The previous multi-frame super-resolution processing system can improve resolution but has limited cell flow rate and hence low throughput when capturing multiple subpixel-shifted cell images. This paper introduces a single-frame super-resolution processing with on-line machine-learning for contact images of cells. A corresponding contact-imaging based microfluidic cytometer prototype is demonstrated for cell recognition and counting. Compared with commercial flow cytometer, less than 8% error is observed for absolute number of microbeads; and 0.10 coefficient of variation is observed for cell-ratio of mixed RBC and HepG2 cells in solution.
Conflict of interest statement
Figures


Similar articles
-
Machine Learning Based Single-Frame Super-Resolution Processing for Lensless Blood Cell Counting.Sensors (Basel). 2016 Nov 2;16(11):1836. doi: 10.3390/s16111836. Sensors (Basel). 2016. PMID: 27827837 Free PMC article.
-
Webcam-based flow cytometer using wide-field imaging for low cell number detection at high throughput.Analyst. 2014 Sep 7;139(17):4322-9. doi: 10.1039/c4an00669k. Analyst. 2014. PMID: 24995370
-
A Microflow Cytometer Based on a Disposable Microfluidic Chip With Side Scatter and Fluorescence Detection Capability.IEEE Trans Nanobioscience. 2015 Dec;14(8):850-6. doi: 10.1109/TNB.2015.2455073. Epub 2015 Sep 25. IEEE Trans Nanobioscience. 2015. PMID: 26415206
-
Parallel imaging microfluidic cytometer.Methods Cell Biol. 2011;102:49-75. doi: 10.1016/B978-0-12-374912-3.00003-1. Methods Cell Biol. 2011. PMID: 21704835 Free PMC article. Review.
-
A review of sorting, separation and isolation of cells and microbeads for biomedical applications: microfluidic approaches.Analyst. 2018 Dec 17;144(1):87-113. doi: 10.1039/c8an01061g. Analyst. 2018. PMID: 30402633 Review.
Cited by
-
Optical Image Sensors for Smart Analytical Chemiluminescence Biosensors.Bioengineering (Basel). 2024 Sep 12;11(9):912. doi: 10.3390/bioengineering11090912. Bioengineering (Basel). 2024. PMID: 39329654 Free PMC article. Review.
-
An on-chip instrument for white blood cells classification based on a lens-less shadow imaging technique.PLoS One. 2017 Mar 28;12(3):e0174580. doi: 10.1371/journal.pone.0174580. eCollection 2017. PLoS One. 2017. PMID: 28350891 Free PMC article.
-
Microfluidic flow cytometry: The role of microfabrication methodologies, performance and functional specification.Technology (Singap World Sci). 2018 Mar;6(1):1-23. doi: 10.1142/S2339547818300019. Epub 2018 Mar 16. Technology (Singap World Sci). 2018. PMID: 29682599 Free PMC article.
-
Capillary-Driven Flow Microfluidics Combined with Smartphone Detection: An Emerging Tool for Point-of-Care Diagnostics.Diagnostics (Basel). 2020 Jul 22;10(8):509. doi: 10.3390/diagnostics10080509. Diagnostics (Basel). 2020. PMID: 32708045 Free PMC article. Review.
-
Design and characterization of a package-less hybrid PDMS-CMOS-FR4 contact-imaging system for microfluidic integration.J Micro Nanolithogr MEMS MOEMS. 2018 Jul;17(3):034501. doi: 10.1117/1.JMM.17.3.034501. Epub 2018 Jul 24. J Micro Nanolithogr MEMS MOEMS. 2018. PMID: 30911341 Free PMC article.
References
-
- Shapiro HM (2003) Practical Flow Cytometry, 4th Edition, Wiley.
-
- Givan A (2001) Flow cytometry: first principles, John Wiley & Sons.
-
- Brown M, Wittwer C (2000) Flow cytometry: principles and clinical applications in hematology. Clinical Chemistry 46: 1221–1229. - PubMed
-
- Gupta GP, Massagué J (2006) Cancer metastasis: building a framework. Cell 127: 679–695. - PubMed
-
- Hammer SM, Eron JJ, Reiss P (2008) Schooley RT, Thompson MA, et al (2008) Antiretroviral treatment of adult HIV infection. Journal of the American Medical Association 300: 555–570. - PubMed
Publication types
MeSH terms
LinkOut - more resources
Full Text Sources
Other Literature Sources
