. 2014 Aug 11;9(8):e104181.
doi: 10.1371/journal.pone.0104181. eCollection 2014.

Nuclear overhauser enhancement mediated chemical exchange saturation transfer imaging at 7 Tesla in glioblastoma patients

Affiliations

Nuclear overhauser enhancement mediated chemical exchange saturation transfer imaging at 7 Tesla in glioblastoma patients

Daniel Paech et al. PLoS One. .

Abstract

Background and purpose: Nuclear Overhauser Enhancement (NOE) mediated chemical exchange saturation transfer (CEST) is a novel magnetic resonance imaging (MRI) technique on the basis of saturation transfer between exchanging protons of tissue proteins and bulk water. The purpose of this study was to evaluate and compare the information provided by three dimensional NOE mediated CEST at 7 Tesla (7T) and standard MRI in glioblastoma patients.

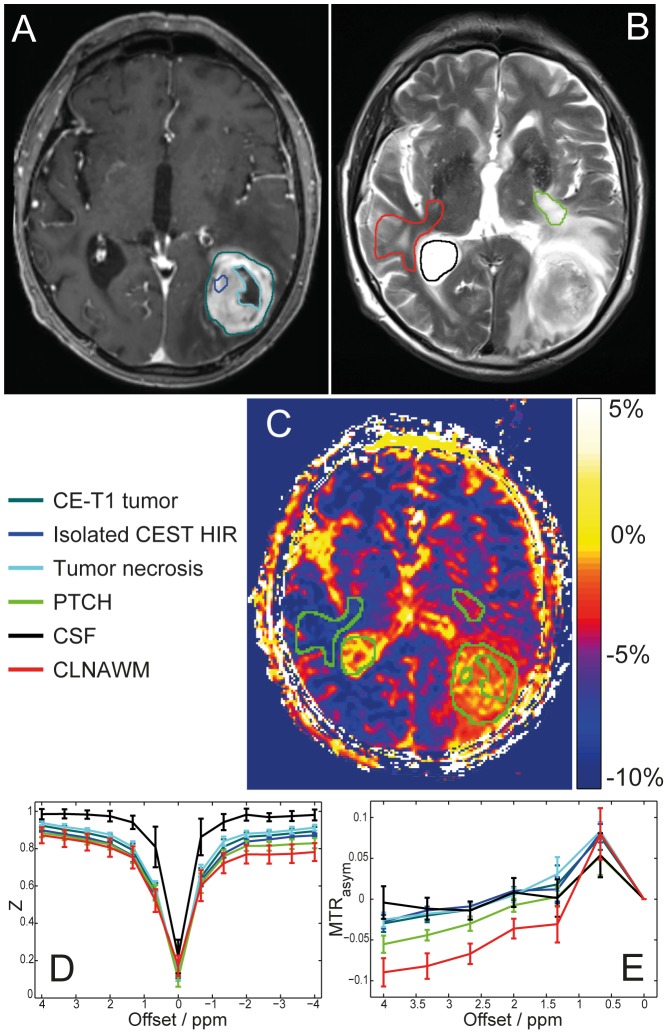
Patients and methods: Twelve patients with newly diagnosed histologically proven glioblastoma were enrolled in this prospective ethics committee-approved study. NOE mediated CEST contrast was acquired with a modified three-dimensional gradient-echo sequence and asymmetry analysis was conducted at 3.3 ppm (B1 = 0.7 µT) to calculate the magnetization transfer ratio asymmetry (MTR(asym)). Contrast enhanced T1 (CE-T1) and T2-weighted images were acquired at 3T and used for data co-registration and comparison.

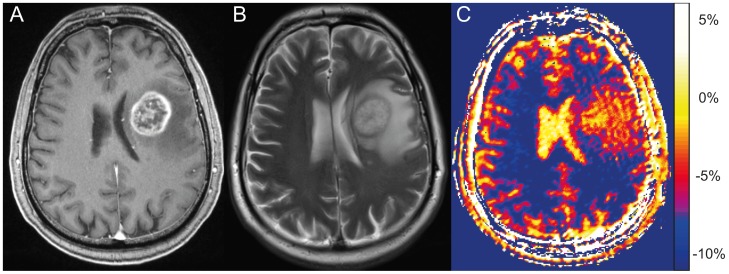
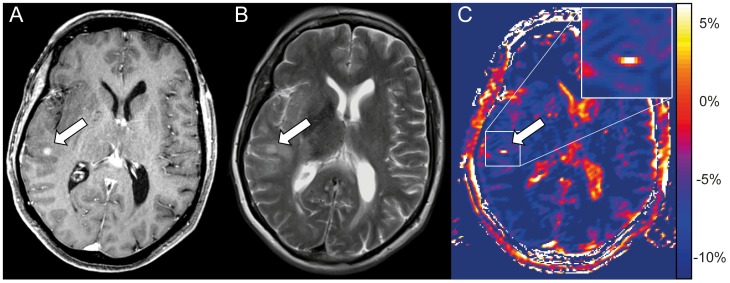
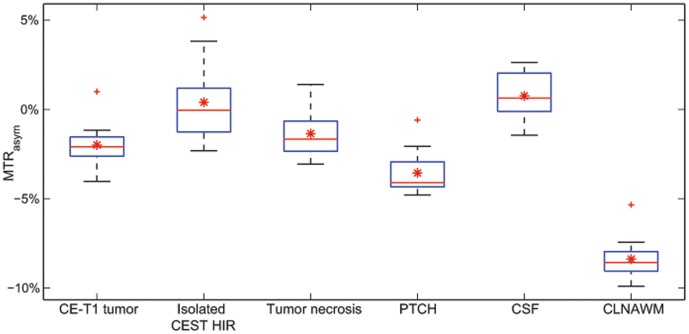
Results: Mean NOE mediated CEST signal based on MTR(asym) values over all patients was significantly increased (p<0.001) in CE-T1 tumor (-1.99 ± 1.22%), tumor necrosis (-1.36 ± 1.30%) and peritumoral CEST hyperintensities (PTCH) within T2 edema margins (-3.56 ± 1.24%) compared to contralateral normal appearing white matter (-8.38 ± 1.19%). In CE-T1 tumor (p = 0.015) and tumor necrosis (p<0.001) mean MTR(asym) values were significantly higher than in PTCH. Extent of the surrounding tumor hyperintensity was smaller in eight out of 12 patients on CEST than on T2-weighted images, while four displayed at equal size. In all patients, isolated high intensity regions (0.40 ± 2.21%) displayed on CEST within the CE-T1 tumor that were not discernible on CE-T1 or T2-weighted images.

Conclusion: NOE mediated CEST Imaging at 7 T provides additional information on the structure of peritumoral hyperintensities in glioblastoma and displays isolated high intensity regions within the CE-T1 tumor that cannot be acquired on CE-T1 or T2-weighted images. Further research is needed to determine the origin of NOE mediated CEST and possible clinical applications such as therapy assessment or biopsy planning.


Conflict of interest statement

Competing Interests: The authors have declared that no competing interests exist.

Figures

Figure 1
Figure 1. Peritumoral hyperintensity on NOE mediated CEST compared to standard MRI.
Left frontal glioblastoma in a 59 year old man at 3 Tesla, CE-T1 (A) and T2-weighted images (B). On the selected slice the CEST contrast at 7 Tesla, based on MTRasym (C), displays peritumoral hyperintensities at equal extent compared to the edema on T2-weighted images. In contrast to T2-weighted images, the CEST peritumoral hyperintensity displays an irregular border and subareas of different signal intensity.
Figure 2
Figure 2. Tumor satellite lesion displays hyperintense on NOE mediated CEST.
Tumor satellite of a glioblastoma subcortical temporal right in a 67 year old woman. The satellite presents a clear enhancement on CE-T1 (arrow in A) and barely displays on the T2-weighted image (arrow in B). In contrast, the satellite displays clearly hyperintense on CEST based on MTRasym (C) and matches with the area of contrast enhancement on the CE-T1 image (A). Furthermore also CSF in lateral ventricles and cerebral sulci displays hyperintense on MTRasym.
Figure 3
Figure 3. Regions of interest (ROI) selection for spectral analysis and MTRasym quantification.
Left occipital glioblastoma of a 79 year old patient, CE-T1 (A) and T2-weighted images (B) with color coded ROIs: CE-T1 tumor, isolated CEST HIR within CE-T1 margins, tumor necrosis, PTCH within T2 edema margins, CSF and CLNAWM. CEST contrast based on MTRasym (C): Same ROIs illustrated in green for improved visualization. Z-spectrum (D) and asymmetry analysis (E) shown. Analyses of Z-spectra reveals that a decrease of NOE upfield effects at −3.3 ppm causes the hyperintense MTRasym contrast in the tumor regions, while no clear APT peak around +3.3 ppm could be identified in any of the analyzed tissues. Even though MTRasym shows high intensities both in CSF and isolated CEST HIR within CE-T1 tumor, Z-spectrum analysis reveals that the underlying asymmetry has a different origin: no saturation transfer is apparent in CSF at ±3.3 ppm (D black line) while in tumor regions (D dark green, dark blue and light blue lines) MTRasym = 0 reflects that NOE signals (−3.3 ppm) and saturation transfer effects at the opposite side of the Z-spectrum (+3.3 ppm) are of equal size. Furthermore the width of the Z-spectrum of CSF is decreased due to the longer T2 relaxation time.
Figure 4
Figure 4. Boxplots of MTRAsym quantification from regions of interest (ROI) analysis over all glioblastoma patients.
Boxplots of mean MTRAsym values on CEST contrast over all patients (N = 12). Overall mean MTRasym (red stars) and outliers (red crosses) are additionally illustrated. MTRasym values in all tumor areas (CE-T1 tumor, isolated CEST HIR in CE-T1 tumor, tumor necrosis) and CSF are significantly higher than in CLNAWM (p<0.001). Average signal intensity in PTCH within T2 edema margins is significantly higher (p<0.001) than in CLNAWM and significantly lower (p = 0.015) than in CE-T1 tumor and tumor necrosis (p<0.001). The whiskers of the boxplot for isolated CEST HIR indicate a high variance within this group, which is due to smaller ROI size and the fact that the isolated CEST HIR were visually selected relative to surrounding signal intensity in CE-T1 tumor.

References

    1. DeAngelis LM (2001) Brain Tumors. New England Journal of Medicine 344: 114–123. - PubMed
    1. Wen PY, Macdonald DR, Reardon DA, Cloughesy TF, Sorensen AG, et al. (2010) Updated Response Assessment Criteria for High-Grade Gliomas: Response Assessment in Neuro-Oncology Working Group. Journal of Clinical Oncology 28: 1963–1972. - PubMed
    1. Scott JN, Brasher PMA, Sevick RJ, Rewcastle NB, Forsyth PA (2002) How often are nonenhancing supratentorial gliomas malignant? A population study. Neurology 59: 947–949. - PubMed
    1. Radbruch A, Lutz K, Wiestler B, Bäumer P, Heiland S, et al. (2012) Relevance of T2 signal changes in the assessment of progression of glioblastoma according to the Response Assessment in Neurooncology criteria. Neuro-Oncology 14: 222–229. - PMC - PubMed
    1. Liu G, Song X, Chan KWY, McMahon MT (2013) Nuts and bolts of chemical exchange saturation transfer MRI. NMR in Biomedicine 26: 810–828. - PMC - PubMed

Publication types