

Comparative 2D-DIGE proteomic analysis of bovine mammary epithelial cells during lactation reveals protein signatures for lactation persistency and milk yield
- PMID: 25111801
- PMCID: PMC4128602
- DOI: 10.1371/journal.pone.0102515
Comparative 2D-DIGE proteomic analysis of bovine mammary epithelial cells during lactation reveals protein signatures for lactation persistency and milk yield
Abstract
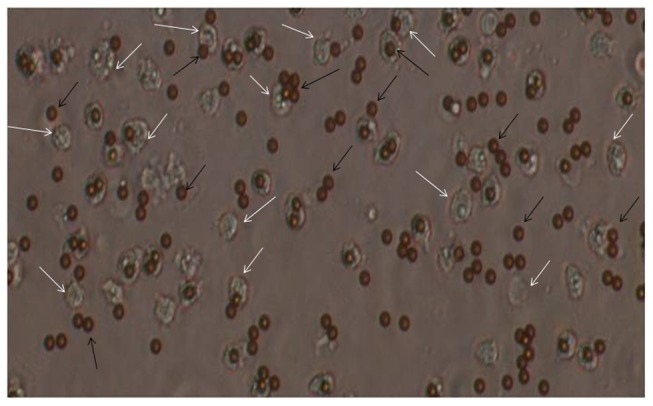
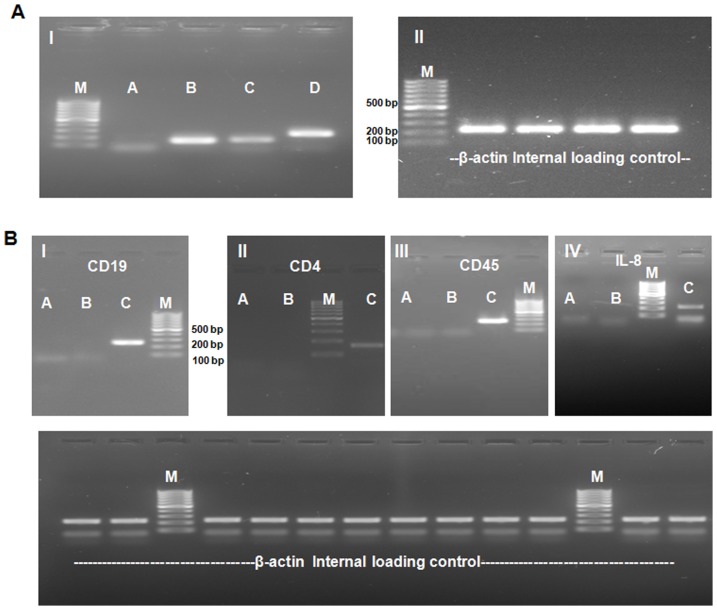
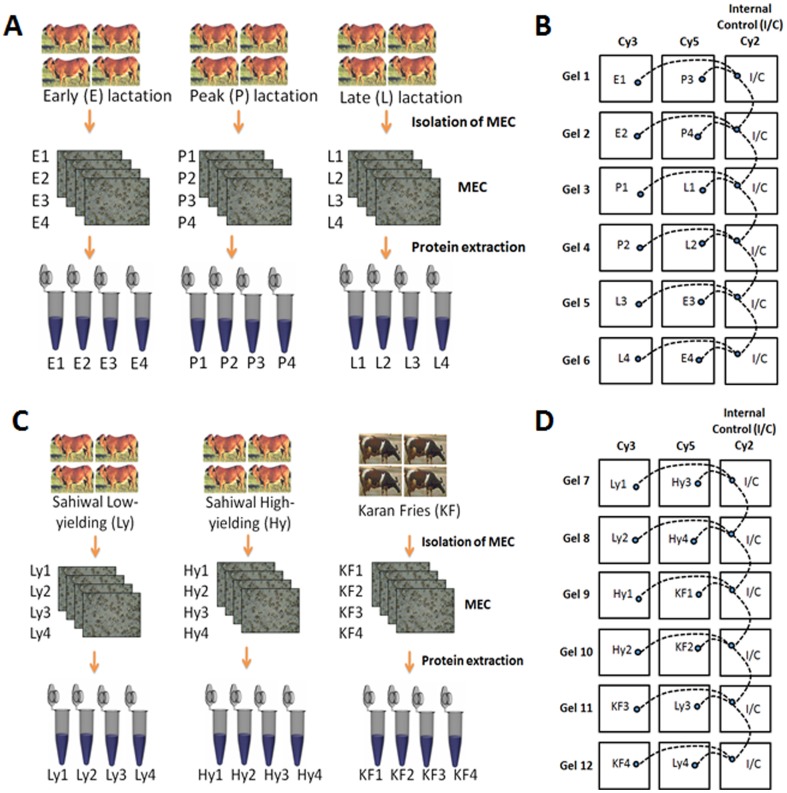
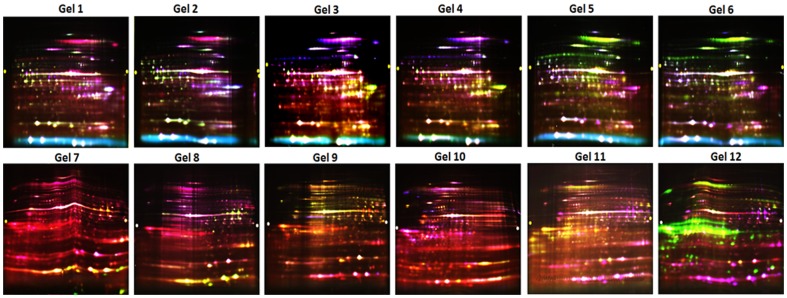
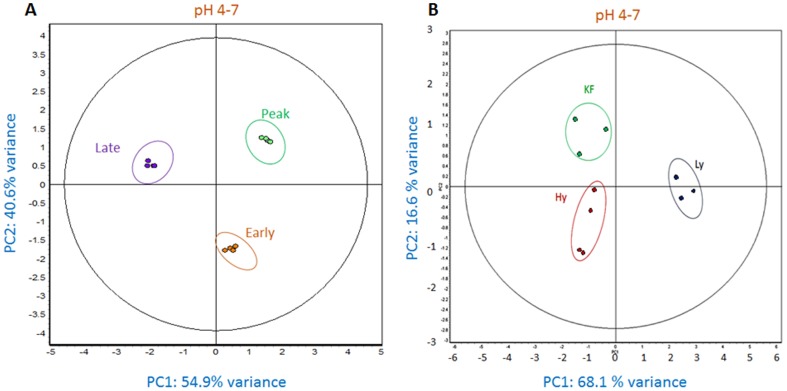
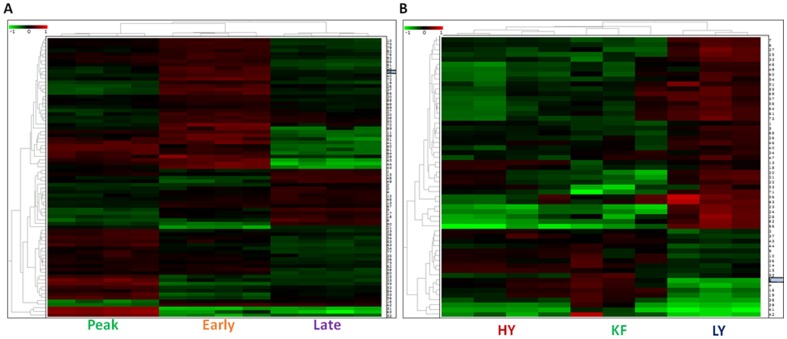
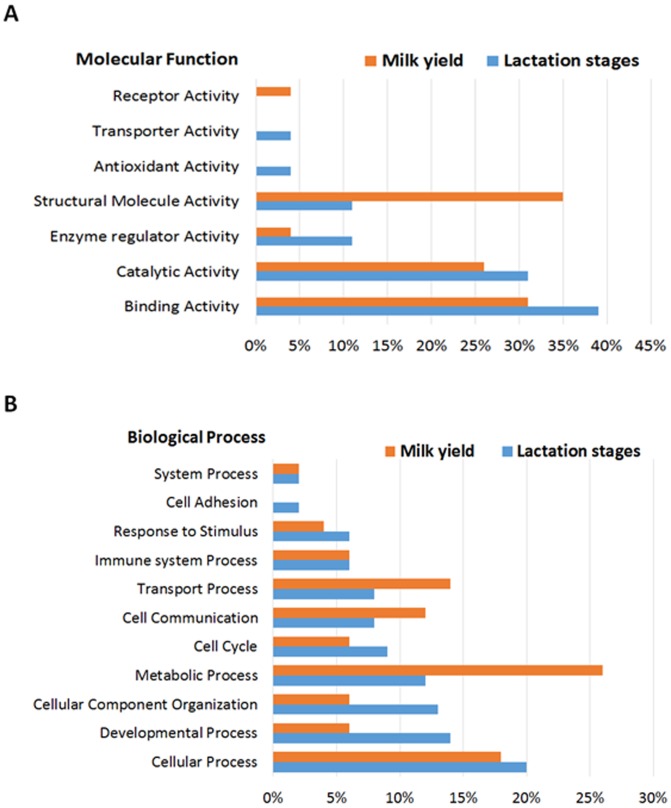
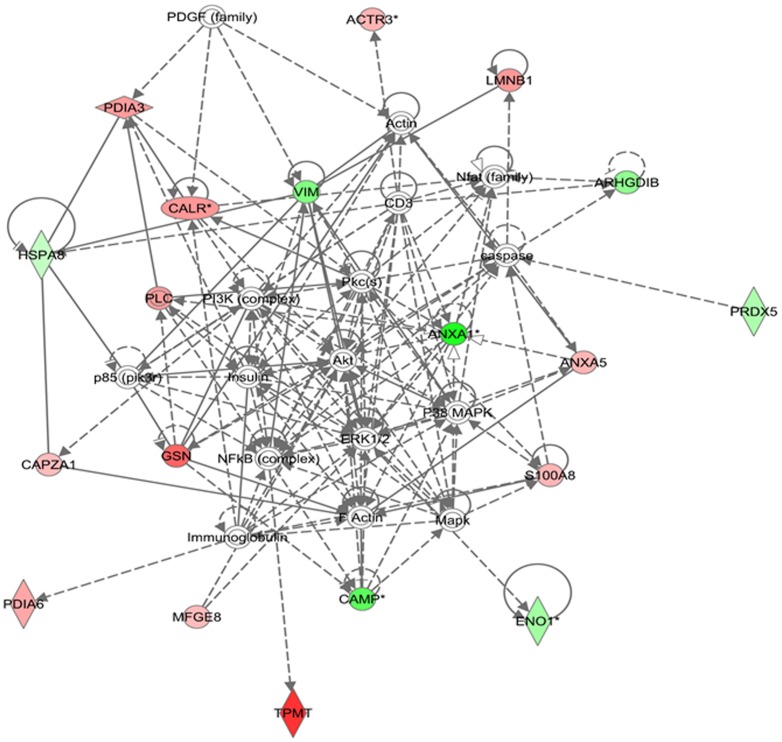
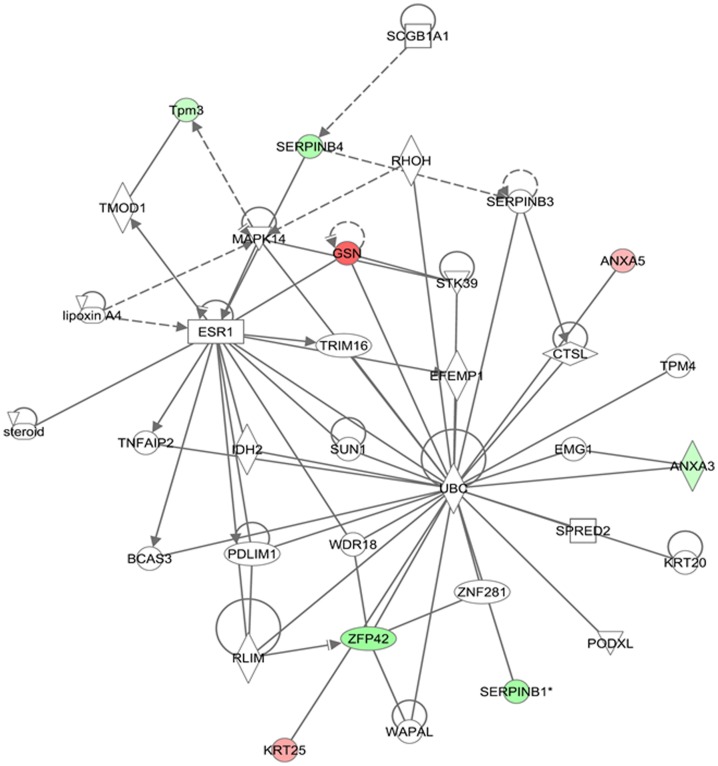
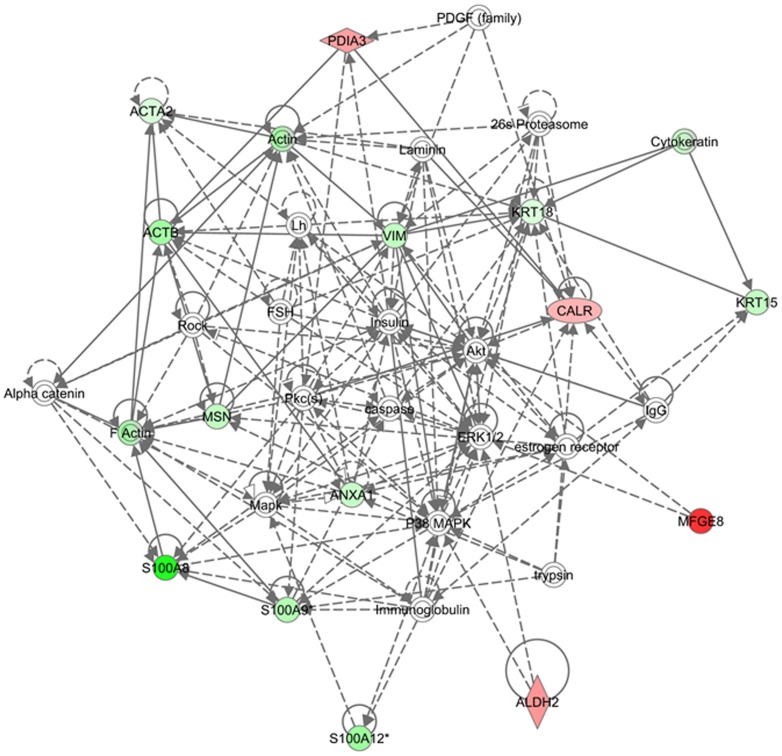
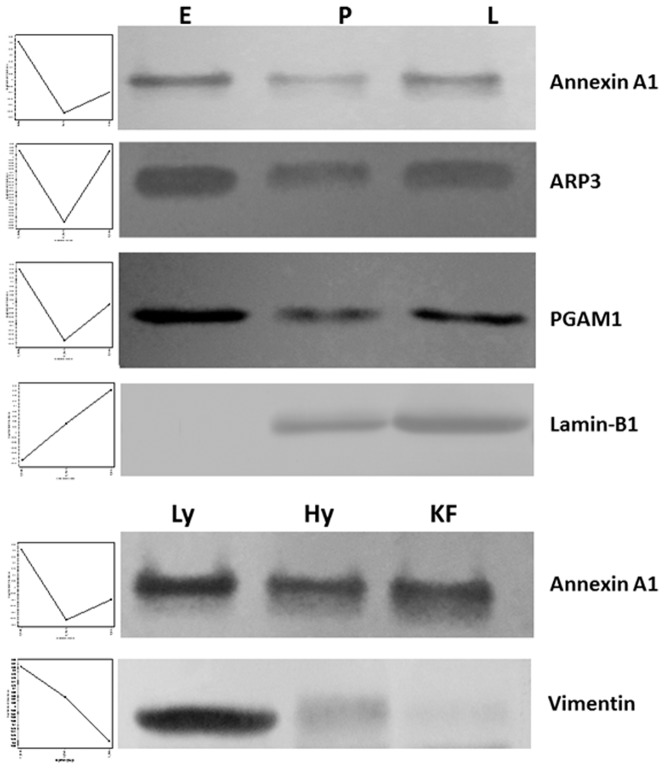
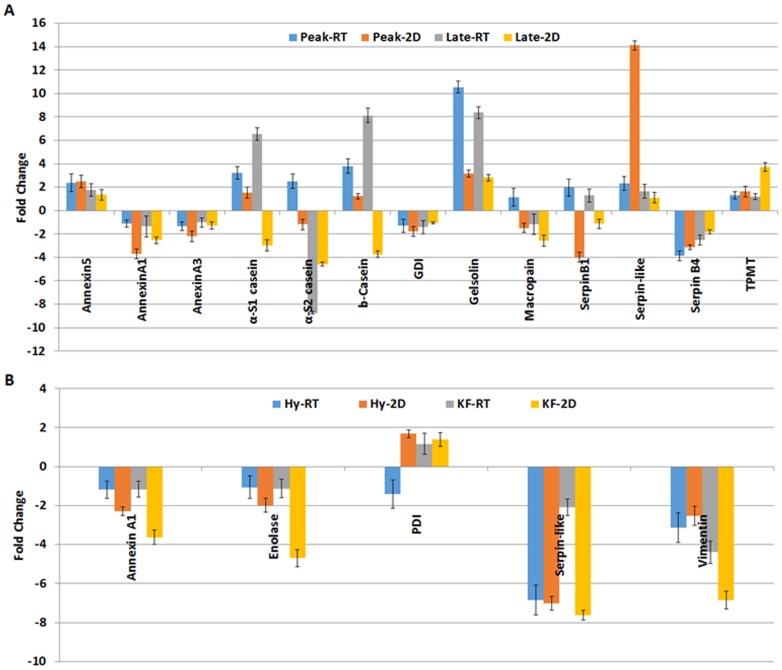
Mammary gland is made up of a branching network of ducts that end with alveoli which surrounds the lumen. These alveolar mammary epithelial cells (MEC) reflect the milk producing ability of farm animals. In this study, we have used 2D-DIGE and mass spectrometry to identify the protein changes in MEC during immediate early, peak and late stages of lactation and also compared differentially expressed proteins in MEC isolated from milk of high and low milk producing cows. We have identified 41 differentially expressed proteins during lactation stages and 22 proteins in high and low milk yielding cows. Bioinformatics analysis showed that a majority of the differentially expressed proteins are associated in metabolic process, catalytic and binding activity. The differentially expressed proteins were mapped to the available biological pathways and networks involved in lactation. The proteins up-regulated during late stage of lactation are associated with NF-κB stress induced signaling pathways and whereas Akt, PI3K and p38/MAPK signaling pathways are associated with high milk production mediated through insulin hormone signaling.
Conflict of interest statement
Figures
Similar articles
-
DIGE based proteome analysis of mammary gland tissue in water buffalo (Bubalus bubalis): lactating vis-a-vis heifer.J Proteomics. 2015 Apr 24;119:100-11. doi: 10.1016/j.jprot.2015.01.018. Epub 2015 Feb 7. J Proteomics. 2015. PMID: 25661041
-
Comparative transcriptome analysis of mammary epithelial cells at different stages of lactation reveals wide differences in gene expression and pathways regulating milk synthesis between Jersey and Kashmiri cattle.PLoS One. 2019 Feb 5;14(2):e0211773. doi: 10.1371/journal.pone.0211773. eCollection 2019. PLoS One. 2019. PMID: 30721247 Free PMC article.
-
Bovine Milk Comparative Proteome Analysis from Early, Mid, and Late Lactation in the Cattle Breed, Malnad Gidda (Bos indicus).OMICS. 2018 Mar;22(3):223-235. doi: 10.1089/omi.2017.0162. Epub 2018 Feb 1. OMICS. 2018. PMID: 29389253
-
Regulation of cell number in the mammary gland by controlling the exfoliation process in milk in ruminants.J Dairy Sci. 2016 Jan;99(1):854-63. doi: 10.3168/jds.2015-9964. J Dairy Sci. 2016. PMID: 26433413 Review.
-
Epigenetic regulation of milk production in dairy cows.J Mammary Gland Biol Neoplasia. 2010 Mar;15(1):101-12. doi: 10.1007/s10911-010-9164-2. Epub 2010 Feb 4. J Mammary Gland Biol Neoplasia. 2010. PMID: 20131087 Review.
Cited by
-
Critical Review on Physiological and Molecular Features during Bovine Mammary Gland Development: Recent Advances.Cells. 2022 Oct 21;11(20):3325. doi: 10.3390/cells11203325. Cells. 2022. PMID: 36291191 Free PMC article. Review.
-
The Goat (Capra hircus) Mammary Gland Mitochondrial Proteome: A Study on the Effect of Weight Loss Using Blue-Native PAGE and Two-Dimensional Gel Electrophoresis.PLoS One. 2016 Mar 31;11(3):e0151599. doi: 10.1371/journal.pone.0151599. eCollection 2016. PLoS One. 2016. PMID: 27031334 Free PMC article.
-
A Review on Bioengineering the Bovine Mammary Gland: The Role of the Extracellular Matrix and Reconstruction Prospects.Bioengineering (Basel). 2025 May 9;12(5):501. doi: 10.3390/bioengineering12050501. Bioengineering (Basel). 2025. PMID: 40428120 Free PMC article. Review.
-
Effects of Essential Amino Acid Deficiency on General Control Nonderepressible 2/Eukaryotic Initiation Factor 2 Signaling and Proteomic Changes in Primary Bovine Mammary Epithelial Cells.Curr Issues Mol Biol. 2022 Feb 25;44(3):1075-1086. doi: 10.3390/cimb44030071. Curr Issues Mol Biol. 2022. PMID: 35723294 Free PMC article.
-
Integrative Analysis of Transcriptome and GWAS Data to Identify the Hub Genes Associated With Milk Yield Trait in Buffalo.Front Genet. 2019 Feb 5;10:36. doi: 10.3389/fgene.2019.00036. eCollection 2019. Front Genet. 2019. PMID: 30804981 Free PMC article.
References
-
- McManaman JL, Neville MC (2003) Mammary physiology and milk secretion. Advanced Drug Delivery Reviews 55: 629–641. - PubMed
-
- Hadsell DL (2003) The insulin-like growth factor system in normal mammary gland function. Breast Disease 17: 3–14. - PubMed
-
- Grossman M, Koops W (2003) Modeling extended lactation curves of dairy cattle: A biological basis for the multiphasic approach. Journal of Dairy Science 86: 988–998. - PubMed
-
- Vetharaniam I, Davis S, Soboleva T, Shorten P, Wake G (2003) Modeling the interaction of milking frequency and nutrition on mammary gland growth and lactation. Journal of Dairy Science 86: 1987–1996. - PubMed
-
- Knight C, Wilde C (1987) Mammary growth during lactation: implications for increasing milk yield. J Dairy Sci 70: 1991–2000. - PubMed
Publication types
MeSH terms
Substances
LinkOut - more resources
Full Text Sources
Other Literature Sources
