

A multi-institution evaluation of MLC log files and performance in IMRT delivery
- PMID: 25112533
- PMCID: PMC4251954
- DOI: 10.1186/1748-717X-9-176
A multi-institution evaluation of MLC log files and performance in IMRT delivery
Abstract
Background: The multileaf collimator (MLC) is a critical component to accurate intensity-modulated radiotherapy (IMRT) delivery. This study examined MLC positional accuracy via MLC logs from Varian machines from six institutions and three delivery techniques to evaluate typical positional accuracy and treatment and mechanical parameters that affect accuracy. Typical accuracy achieved was compared against TG-142 recommendations for MLC performance; more appropriate recommendations are suggested.
Methods: Over 85,000 Varian MLC treatment logs were collected from six institutions and analyzed with FractionCHECK. Data were binned according to institution and treatment type to determine overall root mean square (RMS) and 95th percentile error values, and then to look for correlations between those errors and with mechanical and treatment parameters including mean and maximum leaf speed, gantry angle, beam-on time, mean leaf error, and number of segments.
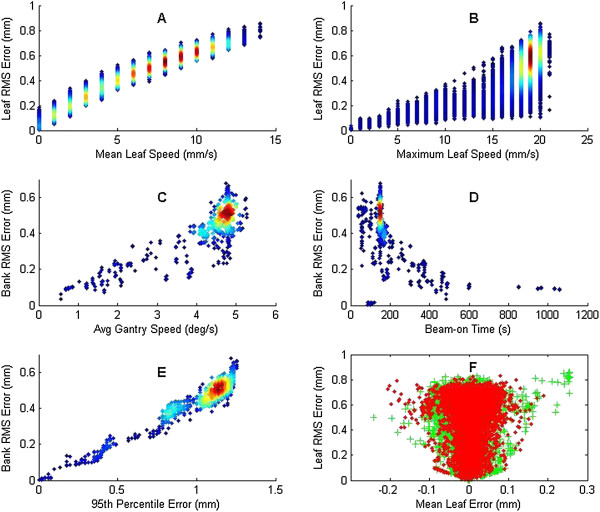
Results: Results of treatment logs found that leaf RMS error and 95th percentile leaf error were consistent between institutions, but varied by treatment type. The step and shoot technique had very small errors: the mean RMS leaf error was 0.008 mm. For dynamic treatments the mean RMS leaf error was 0.32 mm, while volumetric-modulated arc treatment (VMAT) showed an RMS leaf error of 0.46 mm. Most MLC leaf errors were found to be well below TG-142 recommended tolerances. For the dynamic and VMAT techniques, the mean and maximum leaf speeds were significantly linked to the leaf RMS error. Additionally, for dynamic delivery, the mean leaf error was correlated with RMS error, whereas for VMAT the average gantry speed was correlated. For all treatments, the RMS error and the 95th percentile leaf error were correlated.
Conclusions: Restricting the maximum leaf speed can help improve MLC performance for dynamic and VMAT deliveries. Furthermore, the tolerances of leaf RMS and error counts for all treatment types should be tightened from the TG-142 values to make them more appropriate for clinical performance. Values of 1 mm for the 95th percentile of leaf RMS error and 1.5 mm for the 95th percentile leaf error are suggested as action levels for all treatment types.
Figures


References
-
- Sun B, Rangaraj D, Boddu S, Goddu M, Yang D, Palaniswaamy G, Yaddanapudi S, Wooten O, Mutic S. “Evaluation of the efficiency and effectiveness of independent dose calculation followed by machine log file analysis against conventional measurement based IMRT QA,”. J Appl Clin Med Phys Am Coll Med Phys. 2012;13(5):3837. - PMC - PubMed
-
- Klein EE, Hanley J, Bayouth J, Yin F-F, Simon W, Dresser S, Serago C, Aguirre F, Ma L, Arjomandy B, Liu C, Sandin C, Holmes T, Task Group 142, American Association of Physicists in Medicine Task group 142 report: quality assurance of medical accelerators. Med Phys. 2009;36(9):4197–4212. doi: 10.1118/1.3190392. - DOI - PubMed
Publication types
MeSH terms
Grants and funding
LinkOut - more resources
Full Text Sources
Other Literature Sources
Miscellaneous
