. 2014 Sep 26;289(39):27019-27033.
doi: 10.1074/jbc.M114.593780. Epub 2014 Aug 11.

Oligomeric state of purified transient receptor potential melastatin-1 (TRPM1), a protein essential for dim light vision

Affiliations

Oligomeric state of purified transient receptor potential melastatin-1 (TRPM1), a protein essential for dim light vision

Melina A Agosto et al. J Biol Chem. .

Abstract

Transient receptor potential melastatin-1 (TRPM1) is essential for the light-induced depolarization of retinal ON bipolar cells. TRPM1 likely forms a multimeric channel complex, although almost nothing is known about the structure or subunit composition of channels formed by TRPM1 or any of its close relatives. Recombinant TRPM1 was robustly expressed in insect cells, but only a small fraction was localized to the plasma membrane. Similar intracellular localization was observed when TRPM1 was heterologously expressed in mammalian cells. TRPM1 was affinity-purified from Sf9 cells and complexed with amphipol, followed by detergent removal. In blue native gels and size exclusion chromatography, TRPM1 migrated with a mobility consistent with detergent- or amphipol-bound dimers. Cross-linking experiments were also consistent with a dimeric subunit stoichiometry, and cryoelectron microscopy and single particle analysis without symmetry imposition yielded a model with approximate 2-fold symmetrical features. Finally, electron microscopy of TRPM1-antibody complexes revealed a large particle that can accommodate TRPM1 and two antibody molecules. Taken together, these data indicate that purified TRPM1 is mostly dimeric. The three-dimensional structure of TRPM1 dimers is characterized by a small putative transmembrane domain and a larger domain with a hollow cavity. Blue native gels of solubilized mouse retina indicate that TRPM1 is present in two distinct complexes: one similar in size to the recombinant protein and one much larger. Because dimers are likely not functional ion channels, these results suggest that additional partner subunits participate in forming the transduction channel required for dim light vision and the ON pathway.

Keywords: Cryoelectron Microscopy; G Protein Signaling; Ion Channel; Membrane Protein; Transient Receptor Potential Channels (TRP Channels); Vision.


Figures

FIGURE 1.
FIGURE 1.
Expression of TRPM1 in Sf9 cells. A, Sf9 cells were infected with baculovirus expressing TRPM1–1D4 (panels i and ii) or a control virus (GST-nyctalopin; panel iii). At 46 hpi, cells were fixed, permeabilized, and labeled with 1D4Ab (green) and DAPI (blue). Cells were imaged by confocal fluorescence microscopy; projections (panel i) or single optical slices near the middle of the cells (panels ii and iii) are shown. Scale bar, 10 μm. B, 1D4 Western blot of cells infected with TRPM1–1D4-expressing baculovirus or mock-infected and harvested at the indicated time point. C, live cells infected with baculovirus expressing TRPM1–1D4 or Gαo were treated with biotinylation reagent (+NHS-b) or mock-treated (−NHS-b) at ∼46 hpi. The reaction was quenched, cells were lysed in fos-choline-14, and biotinylated proteins were precipitated with streptavidin-agarose. Total (T), flow-through (FT), and bead-bound (B) fractions are shown. The flow-through was subjected to a second round of binding with fresh beads. No TRPM1 was detected in the second bound fraction (B2), indicating that the capacity of the beads was not exceeded. Similar results were obtained from two independent experiments. D, Sf9 cells infected with baculovirus expressing TRPM1–1D4 were labeled with WGA (red) at 42 hpi, then fixed, permeabilized, and labeled with 1D4Ab (green). A single optical slice is shown. Scale bar, 10 μm.
FIGURE 2.
FIGURE 2.
Detergent screen. Sf9 cell membranes were incubated with the indicated detergent for 90 min at 4 °C followed by centrifugation at 100,000 × g for 1 h. A, SDS-PAGE and 1D4 Western blot of pellet (P) and supernatant (S) fractions. B, BN-PAGE and 1D4 Western blot of supernatant fractions from membranes solubilized in fos-choline-12 (Fos-12) and fos-choline-14 (Fos-14). DM, decyl β-maltoside; DDM, dodecyl β-maltoside; OG, octyl β-glucoside.
FIGURE 3.
FIGURE 3.
Expression of TRPM1 in mammalian cells. HEK cells transiently transfected with TRPM1–1D4 (A) or co-transfected with TRPM1–1D4 and GFP (B) were fixed and permeabilized at 36–42 h post-transfection and labeled with 1D4Ab (A and B) and WGA (A) as a membrane marker. Single optical sections (A) or single slices through the reconstructed volume after deconvolution (B) are shown. Scale bar, 10 μm. C, detergent screen with membranes from transfected HEK cells as described in Fig. 2. Fos-12, fos-choline-12; Fos-14, fos-choline-14; DM, decyl β-maltoside; DDM, dodecyl β-maltoside; OG, octyl β-glucoside; P, pellet; S, supernatant.
FIGURE 4.
FIGURE 4.
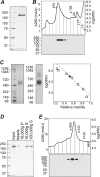
Purification of TRPM1 from Sf9 cell membranes. A, SDS-PAGE and Coomassie staining of purified protein. B, size exclusion chromatography of purified protein in buffer containing fos-choline-14. Fractions were subjected to SDS-PAGE and Western blotting (bottom). C, BN-PAGE of purified protein in fos-choline-14 followed by Coomassie staining (left) or 1D4 Western blotting (middle). The calibration curve used for determining the apparent molecular mass (right, dashed line) was constructed from the 720-, 480-, 242-, and 146-kDa markers. D, Coomassie-stained SDS-PAGE of input protein, protein stuck to BioBeads after amphipol exchange and detergent removal, and supernatant (S) and pellet (P) fractions after centrifugation at 16,000 × g. Approximately 50% of the input protein was recovered in the supernatant; further centrifugation at 100,000 × g did not result in additional loss of protein. E, size exclusion chromatography of TRPM1-amphipol complexes in detergent-free buffer. Fractions were subjected to 1D4 Western blotting (bottom) to confirm the identity of the peak. Peak positions of molecular weight markers in B and E are shown as open diamonds. mAU, milli-absorbance units.
FIGURE 5.
FIGURE 5.
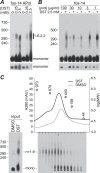
Cross-linking of purified TRPM1. A, purified protein in fos-choline-14 (fos-14) or complexed with amphipol (APol) was treated with 0.25 or 2.5 mm DST or mock-treated with DMSO and analyzed by SDS-PAAGE and 1D4 Western blotting. Calculated sizes of the cross-linked bands relative to the monomer molecular mass (184 kDa) are indicated. A shorter exposure of the same blot (bottom) is included to show the depletion of the monomer band in cross-linked samples. B, protein (prot) in fos-choline-14 was cross-linked at the indicated concentration and then diluted to equivalent concentrations for SDS-PAAGE and 1D4 Western blotting. C, size exclusion chromatography of cross-linked TRPM1. Protein-amphipol complexes cross-linked with 2.5 mm DST or mock-treated with DMSO were separated on a size exclusion chromatography column, and column fractions from the cross-linked sample were subjected to SDS-PAAGE and 1D4 Western blotting (bottom). The lane with the highest total protein, determined by quantification of total signal intensity in each lane, is indicated with an asterisk. Peak positions of molecular weight markers are shown as open diamonds. mAU, milli-absorbance units.
FIGURE 6.
FIGURE 6.
Comparison of TRPM1 models reconstructed from ∼3,700 ice images with C1 (top) or C2 (bottom) symmetry. Front, bottom, and top views and corresponding section views are shown.
FIGURE 7.
FIGURE 7.
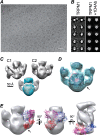
Electron microscopy of TRPM1–1D4Ab complexes. Scale bar, 500 Å. A, sample field of TRPM1–1D4Ab complexes stained with Nanovan. B, three-dimensional maps were reconstructed from ∼3,500 TRPM1–1D4Ab particles, and for comparison, a three-dimensional map of TRPM1 alone was reconstructed from ∼3,000 images of negatively stained TRPM1. Class averages (left) and corresponding projections (right) are shown. C, top, reconstructions with C1 or C2 symmetry imposed. Bottom, superposition of TRPM1 (blue) and TRPM1–1D4Ab (gray) maps. Maps were low-pass filtered to 30 Å and displayed at a threshold corresponding to ∼360 (TRPM1 dimer) and ∼700 kDa (TRPM1 dimer plus two IgG1 molecules), respectively. D, TRPM1–1D4Ab map rendered at two different thresholds. The arrow indicates the highest density connection between the IgG and the TRPM1 body. E, the IgG portion of the map was fit with two Fab (red and magenta) and one Fc (blue) domains (Protein Data Bank code 1IGY (77)). The proposed 1D4-binding Fab is indicated with an arrow.
FIGURE 8.
FIGURE 8.
Cryoelectron microscopy reconstruction of TRPM1. A, sample field of TRPM1-amphipol embedded in vitreous ice with continuous carbon film. Scale bar, 500 Å. The three-dimensional map was reconstructed from ∼7,900 particles with C2 symmetry imposed. Projections from the three-dimensional map (first column) and corresponding class averages (second column) are shown. B, distribution of particle orientations in the asymmetric unit (minimum, 12; maximum, 92). C, Fourier shell correlation curve, determined from independent maps made using even and odd halves of the data, indicates a resolution of ∼22 Å (at a Fourier shell correlation of 0.143). D, different views of the final three-dimensional reconstruction of TRPM1 presented at a threshold corresponding to a molecular mass of 360 kDa.
FIGURE 9.
FIGURE 9.
Analysis of TRPM1 in mouse retina. A, retina lysates (∼50 μg) from wild-type (WT) or Trpm1−/− (KO) mice were subjected to SDS-PAGE and Western blotting for TRPM1 with mAbs 274G7 and 545H5, or actin antibody, followed by anti-mouse HRP secondary antibody, secondary antibody only, or biotinylated 545H5 (biot-545) followed by streptavidin-HRP. Endogenous antibody heavy chain dimers (Ab HC) are detected by the secondary antibody. B, detergent screen. WT retina lysate was incubated with the indicated detergent for 90 min at 4 °C followed by centrifugation at 100,000 × g for 1 h. Pellet (P) and supernatant (S) fractions were analyzed by SDS-PAGE and Western blotting with 274G7. C, retina lysates from WT and KO mice were solubilized with fos-choline-14 (Fos-14) and analyzed by BN-PAGE and Western blot with biotinylated 545H5 (left) or SDS-PAGE and Western blot with 545H5 or actin antibody (right). Fos-12, fos-choline-12; DM, decyl β-maltoside; DDM, dodecyl β-maltoside; OG, octyl β-glucoside.
FIGURE 10.
FIGURE 10.
Alignment with TRPV1 and homology model. A, the posterior probability of location in a TM helix, calculated using TMHMM (45), is plotted for residues 784–1176 of TRPM1. The HHpred (46) secondary structure (s.s.) prediction and alignment with TRPV1 is shown below. The ∣, +, and . represent very good, good, and poor matches, respectively. The rat TRPV1 sequence from the structure lacking pore loop residues 604–626 (Protein Data Bank code 3J5P (30)) was used. TRPV1 TM helices S1–S6 and pore helix (gray bars) and selectivity filter (sf) (black bar) are indicated. The location of the TRPM1 A1068T nob mutation (24) is also indicated. B, side view (top) and extracellular view (bottom) of two C2-related (diagonally opposite) TRPV1 TM domains (gray) superposed with the TRPM1 homology model (red) aligned at the S5 helix. C, extracellular view of the TRPV1 tetramer pore region (gray) and TRPM1 homology model (red). TRPV1 selectivity filter residues Gly-643 and Met-644 are indicated as sticks along with candidate TRPM1 selectivity filter residues Gly-1057 and Glu-1058. D, two subunits of the TRPM1 TM domain homology model were fit into the EM map. The N and C termini of the model are shown as orange and yellow spheres, respectively, and the pore helix is red.

Similar articles

Cited by

References

    1. Lukasiewicz P. D. (2005) Synaptic mechanisms that shape visual signaling at the inner retina. Prog. Brain Res. 147, 205–218 - PubMed
    1. Dhingra A., Lyubarsky A., Jiang M., Pugh E. N., Jr., Birnbaumer L., Sterling P., Vardi N. (2000) The light response of ON bipolar neurons requires Gαo. J. Neurosci. 20, 9053–9058 - PMC - PubMed
    1. Masu M., Iwakabe H., Tagawa Y., Miyoshi T., Yamashita M., Fukuda Y., Sasaki H., Hiroi K., Nakamura Y., Shigemoto R., Takada M., Nakamura K., Nakao K., Katsuki M., Nakanishi S. (1995) Specific deficit of the ON response in visual transmission by targeted disruption of the mGluR6 gene. Cell 80, 757–765 - PubMed
    1. Nakajima Y., Iwakabe H., Akazawa C., Nawa H., Shigemoto R., Mizuno N., Nakanishi S. (1993) Molecular characterization of a novel retinal metabotropic glutamate receptor mGluR6 with a high agonist selectivity for l-2-amino-4-phosphonobutyrate. J. Biol. Chem. 268, 11868–11873 - PubMed
    1. Nawy S. (1999) The metabotropic receptor mGluR6 may signal through Go, but not phosphodiesterase, in retinal bipolar cells. J. Neurosci. 19, 2938–2944 - PMC - PubMed

Publication types

MeSH terms

LinkOut - more resources