. 2014 Sep 19;289(38):26597-26606.
doi: 10.1074/jbc.M114.586032. Epub 2014 Aug 11.

Evidence for a molecular diode-based mechanism in a multispecific ATP-binding cassette (ABC) exporter: SER-1368 as a gatekeeping residue in the yeast multidrug transporter Pdr5

Affiliations

Evidence for a molecular diode-based mechanism in a multispecific ATP-binding cassette (ABC) exporter: SER-1368 as a gatekeeping residue in the yeast multidrug transporter Pdr5

Jitender Mehla et al. J Biol Chem. .

Abstract

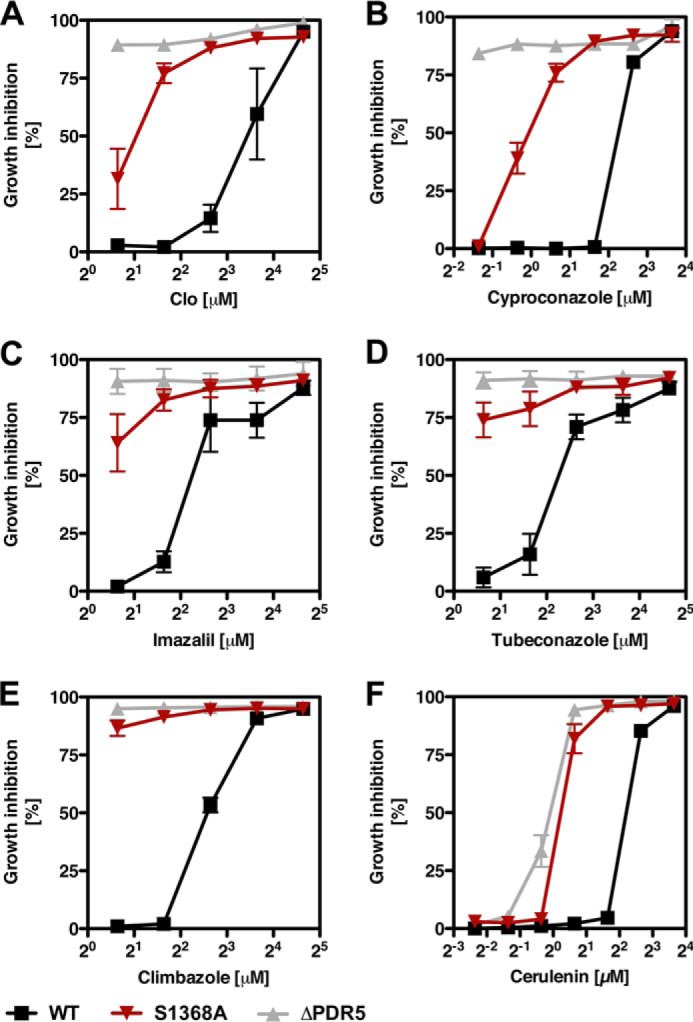
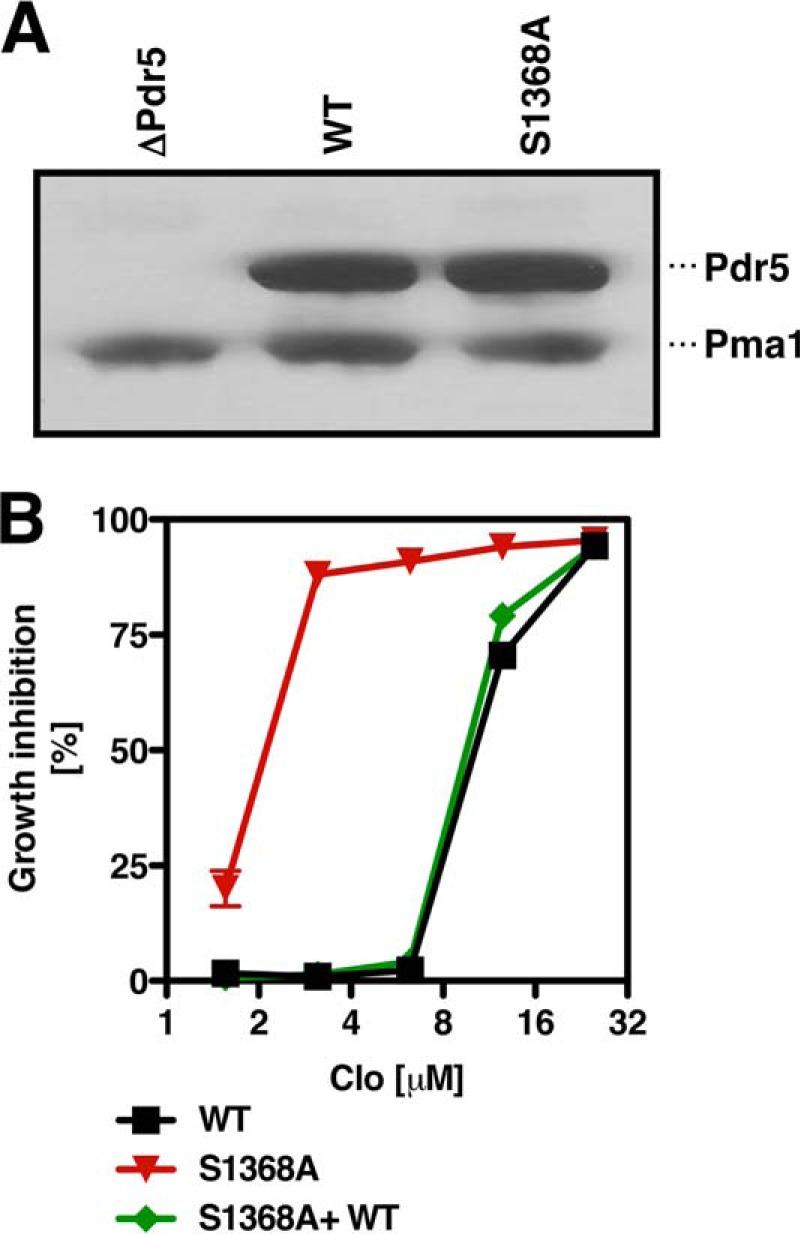
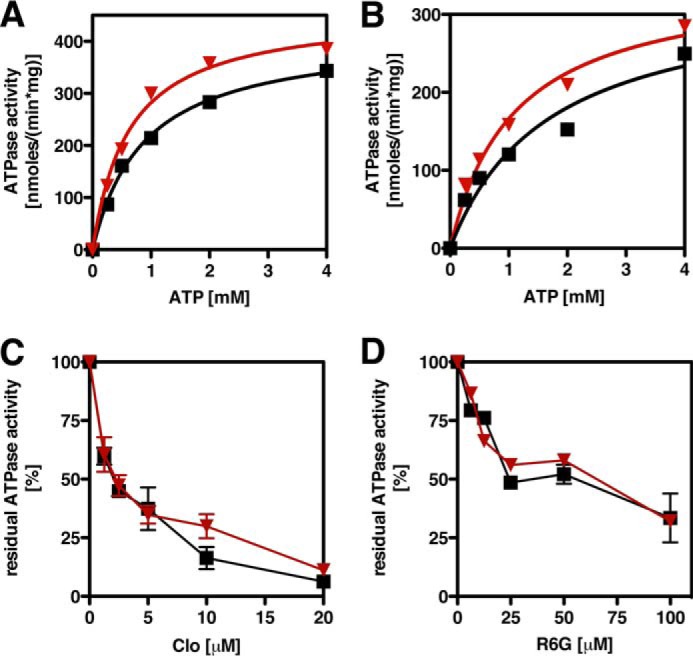
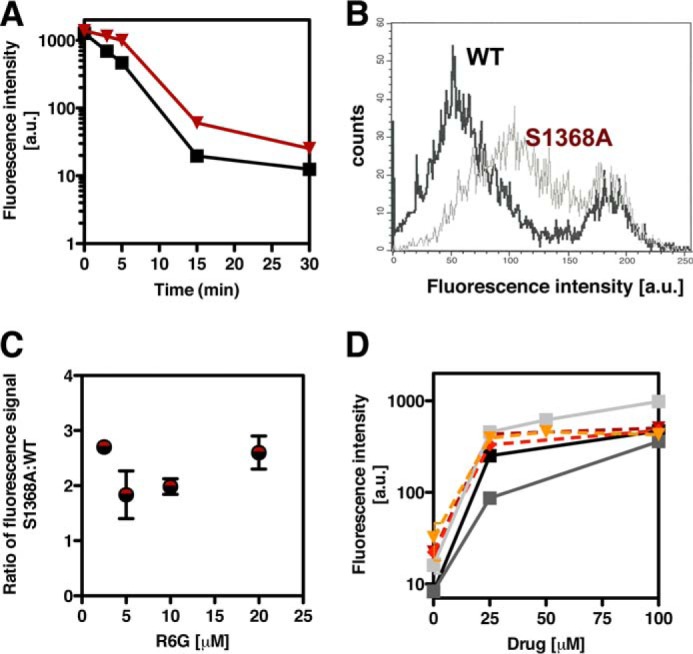
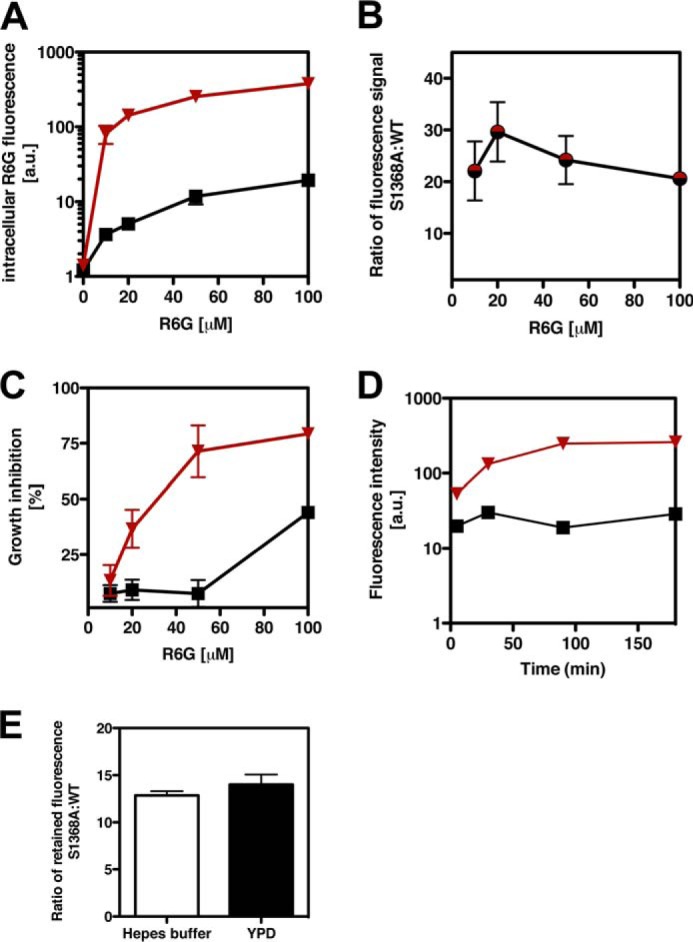
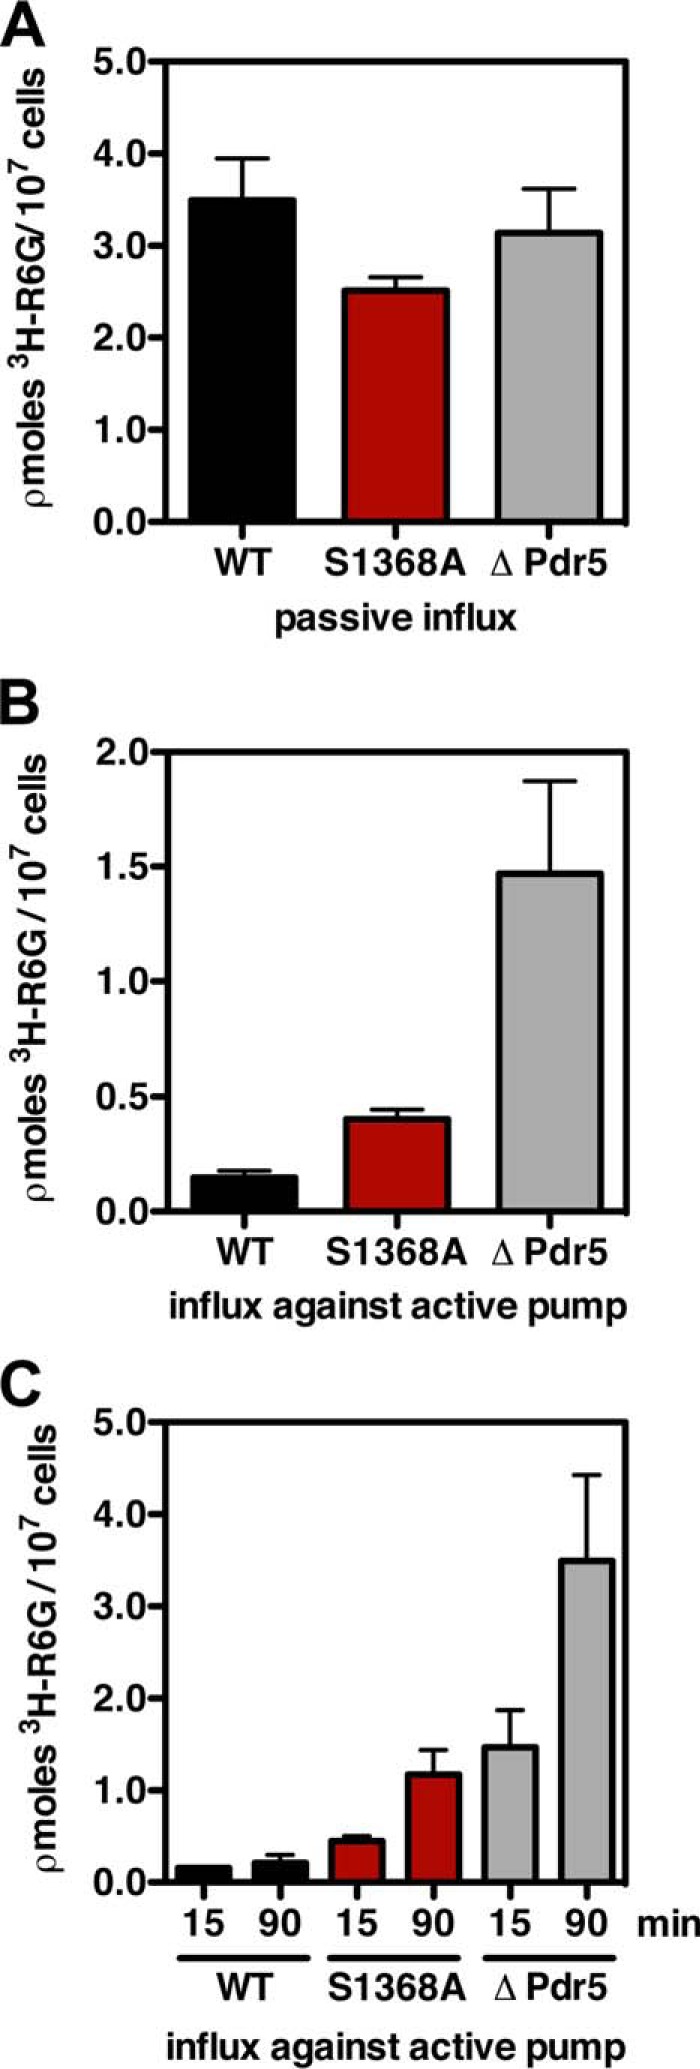
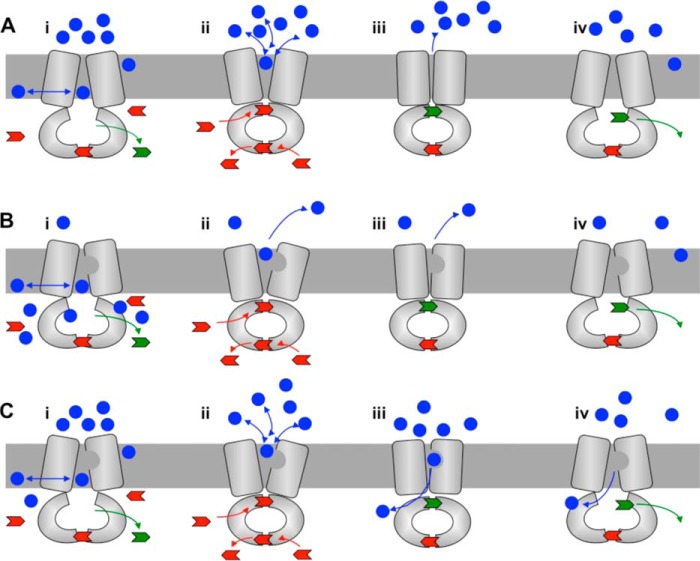
ATP-binding cassette multidrug efflux pumps transport a wide range of substrates. Current models suggest that a drug binds relatively tightly to a transport site in the transmembrane domains when the protein is in the closed inward facing conformation. Upon binding of ATP, the transporter can switch to an outward facing (drug off or drug releasing) structure of lower affinity. ATP hydrolysis is critically important for remodeling the drug-binding site to facilitate drug release and to reset the transporter for a new transport cycle. We characterized the novel phenotype of an S1368A mutant that lies in the putative drug-binding pocket of the yeast multidrug transporter Pdr5. This substitution created broad, severe drug hypersensitivity, although drug binding, ATP hydrolysis, and intradomain signaling were indistinguishable from the wild-type control. Several different rhodamine 6G efflux and accumulation assays yielded evidence consistent with the possibility that Ser-1368 prevents reentry of the excluded drug.

Keywords: ABC Transporter; ATPase; Drug Transport; Membrane Protein; Multidrug Transporter.


Figures

FIGURE 1.
FIGURE 1.
The S1368A substitution creates profound drug hypersensitivity. We tested cells in liquid cultures, which were incubated at 30 °C for 24 h before determining the extent of growth spectroscopically, as described under “Experimental Procedures.” A–F, shown in each panel (n = 3) are WT (■, black), Δpdr5 (▴, gray) and S1368A (▾, red).
FIGURE 2.
FIGURE 2.
Levels of S1368A in purified PM vesicles are the same as WT; S1368A is responsible for drug hypersensitivity. A, purified PM vesicles (10 μg/lane) were separated by SDS-PAGE and analyzed by Western blotting as described under “Experimental Procedures.” We loaded 10 μg of purified PM vesicle proteins in each well. Lane 1, ΔPdr5; lane 2, WT; lane 3, S1368A. B, S1368A was transformed with pSS607, an integrative plasmid that contains a WT copy of PDR5. The transformant was tested for relative resistance to clo using WT and S1368A strains as controls. We performed this analysis in liquid culture at 30 °C, as described under “Experimental Procedures.” Error bars, S.E. In these experiments, n = 3.
FIGURE 3.
FIGURE 3.
S1368A does not affect ATPase activity. A and B, Pdr5-specific ATPase activity was measured as described previously (12), using 12 μg of protein from PM vesicles that were prepared from double-copy strains. Each reaction was carried out for 8 min at 35 °C. Plots from two pairs of PM vesicles (WT and S1368A) prepared on different dates are shown. C, the effect of clo (1.25–20.0 μm) on ATPase activity was monitored using assay conditions described previously (12) (n = 3). The reaction mixes were preincubated for 5 min at room temperature with clo before initiating activity with the addition of 3 mm ATP. Each reaction was carried out for 8 min at 35 °C. Error bars, S.E. D, inhibition of Pdr5 ATPase by R6G was evaluated using conditions identical to those found in C. Shown in all of the panels are WT (■, black) and S1368A (▾, red).
FIGURE 4.
FIGURE 4.
The major effect of S1368A is not restricted to a single drug-binding site. A, R6G and the indicated drugs were loaded into WT cells. Efflux was initiated by glucose addition, and the transport assays were incubated for 30 min at 30 °C. The remaining cell-associated amount of R6G was determined by its fluorescence. The competing drugs (□ (black line), cerulenin; ● (red line), imazalil; ○ (orange line), tebuconazole) were present during loading and efflux. Error bars, S.E. In this experiment, n = 3. B, inhibition of [125I]IAAP binding to WT (■, black) or S1368A (▴, red) Pdr5 protein by clo was performed as described under “Experimental Procedures” with purified PM vesicles from double-copy S1368A and WT strains.
FIGURE 5.
FIGURE 5.
Extrusion of R6G from preloaded cells is only mildly affected by the S1368A mutation. A, time course of cell-associated R6G fluorescence during a whole cell-based efflux experiment. All transport experiments were performed at 30 °C. Cells were loaded for 90 min with 10 μm R6G under energy-depleting conditions (no glucose), as described under “Experimental Procedures.” Following loading, cells were suspended in 300 μl of 0.05 m Hepes, 1 mm glucose buffer without R6G to initiate R6G efflux, which was monitored as a reduction in cell-associated fluorescence. Shown in these experiments (n = 3) are WT (■, black) and S1368A (▾, red). B, histogram plots from the 15 min time point from one of the experiments shown in A. C, R6G efflux from whole cells was carried out with a range of R6G concentrations (2.5–20 μm) under the same conditions as in A. Efflux was performed for 30 min before determining the cell-associated fluorescence. The n values are 1 for 2.5 μm, 3 for 5.0 and 10 μm, and 2 for 20 μm. In A and C, error bars represent the S.E. D, whole-cell R6G efflux experiments were performed as in Fig. 4A. The concentration-dependent inhibition of R6G efflux was determined by measuring the cell-associated R6G fluorescence after 30 min of efflux. Shown are the R6G transport inhibition curves generated by imazalil (■, black, solid line, WT; ▾, dark red, dashed line, S1368A), tebuconazole (■, gray, solid line, WT; ▾, red, dashed line, S1368A), and 3,9-diacetylcarbazole (■, light gray, solid line, WT; ▾, orange-red, dashed line, S1368A). The WT curves are the same ones found in Fig. 4A and are shown here for comparison. In these experiments, n = 2 for tebuconazole and imazalil, and n = 3 for 3,9-diacetylcarbazole.
FIGURE 6.
FIGURE 6.
S1368A shows a much greater R6G transport deficiency when the external concentration is high regardless of time and buffer conditions. A, cell-associated R6G accumulation was measured after long term growth (20 h at 30 °C) in YPD (nutrient) medium containing varying concentrations of R6G (10–100 μm), as described under “Experimental Procedures.” Shown in each experiment are WT (■, black lines) and S1368A (▾, red lines). B, the ratio of cell-associated fluorescence in S1368A/WT is shown for each concentration of R6G. C, the effect of R6G on the growth of WT and S1368A in YPD medium was determined (■, black lines, WT; ▾, red lines, S1368A; n = 3). D, efflux at various time points in YPD. Assays were performed as described under “Experimental Procedures.” Wild-type (■, black line) and mutant (▾, red line) cells were suspended in YPD broth containing 20 μm R6G and incubated at 30 °C. The ratio of retained fluorescence in S1368A to WT is shown (n = 2). E, transport was evaluated with 20 μm R6G for 90 min in either YPD or 0.02 m Hepes buffer (n = 3). For A–C and E, error bars, S.E. a.u., arbitrary units.
FIGURE 7.
FIGURE 7.
The S1368A strain exhibits enhanced R6G reflux. A, 0.5 × 10⁷ cells of either WT, Δpdr5, or S1368A were loaded with 20 μm unlabeled R6G in 0.02 m Hepes buffer under de-energizing conditions (no glucose) for 90 min at 30 °C. Following this, cells were collected by centrifugation and resuspended in prewarmed (30 °C) 0.02 m Hepes (minus glucose) plus 20 μm [3H]R6G for 15 min to allow passive flux of R6G across the plasma membrane. After this, cells were harvested and washed three times with 1 ml of ice-cold YPD prior to quantitation of cell-associated [3H]R6G by radiometry in a Triathler scintillation counter. Results are shown for WT (n = 9) and the S1368A (n = 9) and Δpdr5 (n = 6) mutant strains. In the experiments shown in A–C, the [3H]R6G was made up of 12% (2.4 μm) [3H]R6G and 88% (17.6 μm) unlabeled compound. B, WT (n = 9), Δpdr5 (n = 3), or S1368A (n = 9) cells were loaded with 20 μm unlabeled R6G as in A but resuspended in prewarmed YPD medium (which contains 20 g/liter glucose) with 20 μm [3H]R6G to measure reflux against actively pumping Pdr5. The reflux of [3H]R6G into cells was measured after 15 min of active transport. C, drug reflux was measured as in B except that cells were incubated with 20 μm [3 H]R6G for 15 and 90 min. In this experiment, n = 3. In all of the panels, error bars represent the S.E.
FIGURE 8.
FIGURE 8.
Ser-1368 is part of a molecular diode. In the model shown, blue circles represent drug molecules, and blue arrows indicate the direction of drug passage. Unhydrolyzed ATP is shown in red; ADP is shown in green. Interactions at the ATP binding site I are based on an initial model of Gupta (15) that was modified in light of recent results with the deviant ATP site (20, 26). Nucleotide exchange occurs at the deviant ATP-binding site, leading to the outward facing or reduced affinity conformation. ATP hydrolysis at the second, canonical site results in drug release and transporter remodeling and restores the higher affinity to the drug-binding sites. Remodeling also prevents reentry of the drug in the WT transporter. A, the WT strain is able to transport drug in a unidirectional manner against a concentration gradient; B, when transport is in the direction of the concentration gradient because the extracellular concentration of drug is relatively low, reflux of the drug back into the cell is minimized in the S1368A mutant. C, the S1368A mutant phenotype is most severe when the external concentration of drug is high, and transport is therefore against a concentration gradient.

References

    1. Gottesman M.M., Fojo T., Bates S. E. (2002) Multidrug resistance in cancer: role of ATP-dependent transporters. Nat. Rev. Cancer 2, 48–58 - PubMed
    1. Kontoyiannis D. P., Lewis R. E. (2002) Antifungal drug resistance of pathogenic fungi. Lancet 359, 1135–1144 - PubMed
    1. Monk B. C., Goffeau A. (2008) Multidrug resistance to antifungals. Science 321, 367–369 - PubMed
    1. Dawson R. J., Locher K. P. (2006) Structure of a bacterial multidrug ABC transporter. Nature 443, 180–185 - PubMed
    1. Oldham M. L., Khare D., Quiocho F. A., Davidson A. L., Chen J. (2007) Crystal structure of a catalytic intermediate of the maltose transporter. Nature 450, 515–521 - PubMed

Publication types

MeSH terms

LinkOut - more resources