. 2014 Sep 19;289(38):26607-26617.
doi: 10.1074/jbc.M114.590950. Epub 2014 Aug 11.

Diacylglycerol kinase δ phosphorylates phosphatidylcholine-specific phospholipase C-dependent, palmitic acid-containing diacylglycerol species in response to high glucose levels

Affiliations

Diacylglycerol kinase δ phosphorylates phosphatidylcholine-specific phospholipase C-dependent, palmitic acid-containing diacylglycerol species in response to high glucose levels

Hiromichi Sakai et al. J Biol Chem. .

Abstract

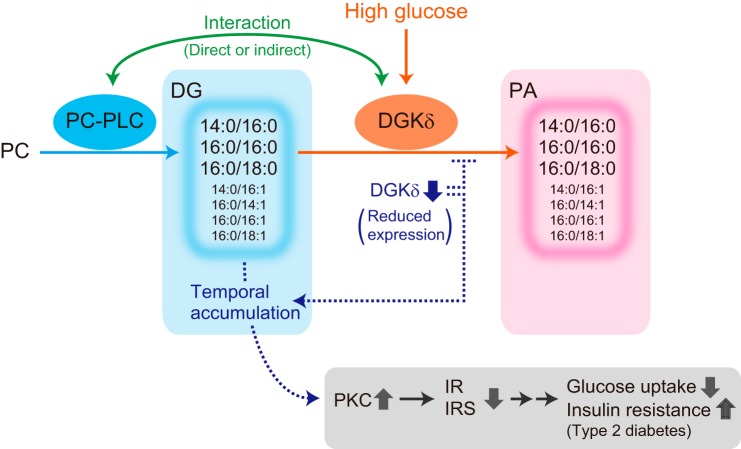
Decreased expression of diacylglycerol (DG) kinase (DGK) δ in skeletal muscles is closely related to the pathogenesis of type 2 diabetes. To identify DG species that are phosphorylated by DGKδ in response to high glucose stimulation, we investigated high glucose-dependent changes in phosphatidic acid (PA) molecular species in mouse C2C12 myoblasts using a newly established liquid chromatography/MS method. We found that the suppression of DGKδ2 expression by DGKδ-specific siRNAs significantly inhibited glucose-dependent increases in 30:0-, 32:0-, and 34:0-PA and moderately attenuated 30:1-, 32:1-, and 34:1-PA. Moreover, overexpression of DGKδ2 also enhanced the production of these PA species. MS/MS analysis revealed that these PA species commonly contain palmitic acid (16:0). D609, an inhibitor of phosphatidylcholine-specific phospholipase C (PC-PLC), significantly inhibited the glucose-stimulated production of the palmitic acid-containing PA species. Moreover, PC-PLC was co-immunoprecipitated with DGKδ2. These results strongly suggest that DGKδ preferably metabolizes palmitic acid-containing DG species supplied from the PC-PLC pathway, but not arachidonic acid (20:4)-containing DG species derived from the phosphatidylinositol turnover, in response to high glucose levels.

Keywords: Diacylglycerol; Diacylglycerol Kinase; Glucose; Palmitic Acid; Phosphatidic Acid; Phosphatidylcholine-specific Phospholipase C; Phospholipase C; Type 2 Diabetes.


Figures

FIGURE 1.
FIGURE 1.
Changes in the total PA and PA molecular species by high glucose stimulation in C2C12 myoblasts and myotubes. A and B, the amounts of the total PAs (A) and major PA molecular species (B) in the glucose-unstimulated or glucose-stimulated C2C12 myoblasts were quantified using the LC/ESI-MS method. The values are presented as the mean ± S.D. (n = 14). *, p < 0.05; **, p < 0.01; ***, p < 0.005 (no stimulation versus glucose stimulation). C and D, the amounts of the total PAs (C) and major PA molecular species (D) that statistically increased in A in the cells stimulated by glucose for 5, 15, or 30 min were detected using the LC/ESI-MS method. The results are presented as the percentage of the value of PA molecular species in glucose-unstimulated cells. The values are presented as the mean (n = 2). Essentially the same results were obtained in two independent experiments. E and F, the amounts of the total PAs (E) and major PA molecular species (F) in the glucose-unstimulated or glucose-stimulated C2C12 myotubes were quantified using the LC/ESI-MS method. The values are presented as the mean ± S.D. (n = 4). *, p < 0.05; **, p < 0.01; ***, p < 0.005 (no stimulation versus glucose stimulation).
FIGURE 2.
FIGURE 2.
Effects of DGKδ-siRNA-1 and -2 on high glucose-induced increases of PA molecular species in C2C12 myoblasts. A and C, the suppression of DGKδ2 expression by DGKδ-siRNA-1 (A) or DGKδ-siRNA-2 (C) was confirmed by Western blot analysis using the anti-DGKδ antibody. Human DGKδ1 and DGKδ2 (11) expressed in COS-7 cells were electrophoresed as a control (A). B and D, the major PA molecular species in the glucose-unstimulated or glucose-stimulated cells transfected with control siRNA or DGKδ-siRNA-1/2 were detected using the LC/ESI-MS method. The results are presented as the percentage of the value of PA molecular species in glucose-unstimulated cells transfected with control siRNA or DGKδ-siRNA-1/2. DGKδ-siRNA-1/2 did not significantly affect the value of PA molecular species in glucose-unstimulated cells. The values are presented as the mean ± S.D. (n = 4). *, p < 0.05; **, p < 0.01; ***, p < 0.005 (no stimulation versus glucose stimulation). #, p < 0.05; ##, p < 0.01 (control siRNA versus DGKδ-siRNA-1 or DGKδ-siRNA-2).
FIGURE 3.
FIGURE 3.
Effect of DGKδ-siRNA-1 on high glucose-induced increases of DG molecular species in C2C12 myoblasts. The major DG molecular species in the glucose-unstimulated or glucose-stimulated cells transfected with control siRNA or DGKδ-siRNA-1 were detected using the ESI-MS method. The results are presented as the percentage of the value of DG molecular species in glucose-unstimulated cells transfected with control siRNA or DGKδ-siRNA-1. DGKδ-siRNA-1 did not significantly affect the value of DG molecular species in glucose-unstimulated cells. The values are presented as the mean ± S.D. (n = 7). *, p < 0.05; ***, p < 0.005 (no stimulation versus glucose stimulation).
FIGURE 4.
FIGURE 4.
PA molecular species in C2C12 cells stably expressing DGKδ2. A, the stable expression of AcGFP-DGKδ2 in C2C12 cells was confirmed by Western blot analysis using the anti-DGKδ antibody. B, the major PA molecular species in the glucose-unstimulated or glucose-stimulated cells stably expressing human DGKδ2 were identified and quantified using LC/ESI-MS. The results are presented as the percentage of the value of PA molecular species in glucose-unstimulated cells transfected with AcGFP alone or AcGFP-DGKδ2. Overexpression of DGKδ2 did not significantly affect the value of PA molecular species in glucose-unstimulated cells. The values are presented as the mean ± S.D. (n = 3). *, p < 0.05; **, p < 0.01; ***, p < 0.005 (no stimulation versus glucose stimulation). #, p < 0.05; ###, p < 0.005 (no overexpression versus DGKδ overexpression).
FIGURE 5.
FIGURE 5.
In vitro DGKδ activity. For measurement of in vitro DGKδ activity, 2 mm (5.4 mol%) 16:0/16:0-, 16:0/18:1-, and 18:0/20:4-DG were used as substrates. The activity of 3×FLAG-tagged DGKδ2 in COS-7 cells was compared with the control. The results are presented as the percentage of the value of activity against 18:0/20:4-DG. The values are presented as the mean ± S.D. (n = 6).
FIGURE 6.
FIGURE 6.
Effects of TOFA and FIPI on the production of PA molecular species in glucose-stimulated C2C12 cells. A, the major PA molecular species in glucose-unstimulated or glucose-stimulated cells treated with DMSO (control) or TOFA were detected using the LC/ESI-MS method. The results are presented as the percentage of the value of PA species in glucose-unstimulated cells treated with DMSO (control) or TOFA. The values are presented as the mean ± S.D. (n = 5). *, p < 0.05; ***, p < 0.005 (no stimulation versus glucose stimulation). #, p < 0.05 (without TOFA versus with TOFA). B, the major PA molecular species in the glucose-unstimulated or glucose-stimulated cells treated with DMSO (control) or FIPI were detected using the LC/ESI-MS method. The results are presented as the percentage of the value of PA species in glucose-unstimulated cells treated with DMSO (control) or FIPI. The values are presented as the mean ± S.D. (n = 3). *, p < 0.05; **, p < 0.01; ***, p < 0.005 (no stimulation versus glucose stimulation). #, p < 0.05 (without FIPI versus with FIPI).
FIGURE 7.
FIGURE 7.
Effect of D609 on high glucose-induced increases in PA and DG molecular species in C2C12 myoblasts. A, the major PA molecular species in the glucose-unstimulated or glucose-stimulated cells treated with DMSO (control) or D609 were detected using the LC/ESI-MS method. The results are presented as the percentage of the value of PA molecular species in glucose-unstimulated cells treated with DMSO (control) or D609. D609 did not significantly affect the value of PA molecular species in glucose-unstimulated cells. The values are presented as the mean ± S.D. (n = 5). *, p < 0.05; ***, p < 0.005 (no stimulation versus glucose stimulation). ###, p < 0.005 (without D609 versus with D609). B and C, the major DG molecular species in the glucose-unstimulated or glucose-stimulated cells treated with DMSO (control) or D609 were detected using the ESI-MS method. B, comparison of +D609 versus −D609 in the absence of glucose. The results are presented as the percentage of the value of DG species in glucose-unstimulated cells treated with DMSO (control). The values are presented as the mean ± S.D. (n = 3). *, p < 0.05; ***, p < 0.005. C, comparison of +glucose versus −glucose in the absence or presence of D609. The results are presented as the percentage of the value of DG species in glucose-unstimulated cells treated with DMSO (control) or D609. D609 did not significantly affect the value of DG molecular species in glucose-unstimulated cells. The values are presented as the mean ± S.D. (n = 3). *, p < 0.05; **, p < 0.01; ***, p < 0.005 (no stimulation versus glucose stimulation). #, p < 0.05; ##, p < 0.01; ###, p < 0.005 (without D609 versus with D609).
FIGURE 8.
FIGURE 8.
Examination of the functional linkage between PC-PLC and DGKδ. Effects of D609 and DGKδ-siRNA-1 on high glucose-induced increases of PA molecular species in C2C12 myoblasts were compared. A, the suppression of DGKδ2 expression by DGKδ-siRNA-1 was confirmed by Western blot analysis using the anti-DGKδ antibody. B, 30:0-, 32:0-, and 34:0-PA in the glucose-unstimulated or glucose-stimulated cells treated with DMSO (control), D609, or D609 and DGKδ-siRNA-1 were detected using the LC/ESI-MS method. The results are presented as the percentage of the value of PA molecular species in glucose-unstimulated cells. The values are presented as the mean ± S.D. (n = 5). ***, p < 0.005 (no stimulation versus glucose stimulation). #, p < 0.05; ##, p < 0.01; ###, p < 0.005 (without D609 versus with D609). †, p < 0.05; †††, p < 0.005 (control siRNA versus DGKδ-siRNA-1). C and D, co-immunoprecipitation of PC-PLC activity with DGKδ2. C, immunoprecipitation (IP) of DGKδ2 using the anti-DGKδ antibody was confirmed by Western blot analysis using the anti-DGKδ antibody. D, PC-PLC activity in the precipitates was measured using the Amplex Red® PC-PLC assay kit. The values are presented as the mean ± S.D. (n = 4). ***, p < 0.005. When the assay was performed in the absence of alkaline phosphatase, the activity was not detectable.
FIGURE 9.
FIGURE 9.
Model for the metabolism pathway utilized by DGKδ. IR, insulin receptor; IRS, insulin receptor substrate.

Similar articles

Cited by

References

    1. Zimmet P., Alberti K. G., Shaw J. (2001) Global and societal implications of the diabetes epidemic. Nature 414, 782–787 - PubMed
    1. Biddinger S. B., Kahn C. R. (2006) From mice to men: insights into the insulin resistance syndromes. Annu. Rev. Physiol. 68, 123–158 - PubMed
    1. Kraegen E. W., Saha A. K., Preston E., Wilks D., Hoy A. J., Cooney G. J., Ruderman N. B. (2006) Increased malonyl-CoA and diacylglycerol content and reduced AMPK activity accompany insulin resistance induced by glucose infusion in muscle and liver of rats. Am. J. Physiol. Endocrinol. Metab. 290, E471–E479 - PubMed
    1. Goto K., Hozumi Y., Kondo H. (2006) Diacylglycerol, phosphatidic acid, and the converting enzyme, diacylglycerol kinase, in the nucleus. Biochim. Biophys. Acta 1761, 535–541 - PubMed
    1. Mérida I., Avila-Flores A., Merino E. (2008) Diacylglycerol kinases: at the hub of cell signalling. Biochem. J. 409, 1–18 - PubMed

Publication types