

Watching individual molecules flex within lipid membranes using SERS
- PMID: 25113088
- PMCID: PMC4129422
- DOI: 10.1038/srep05940
Watching individual molecules flex within lipid membranes using SERS
Abstract
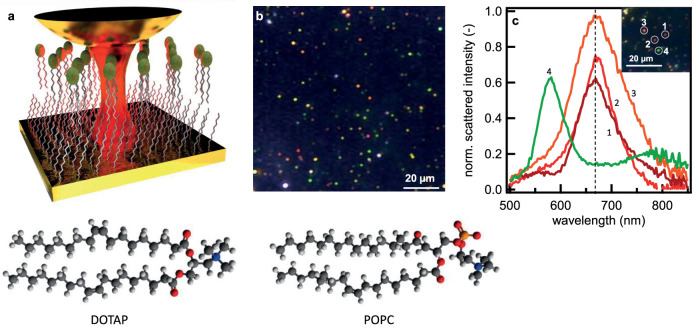
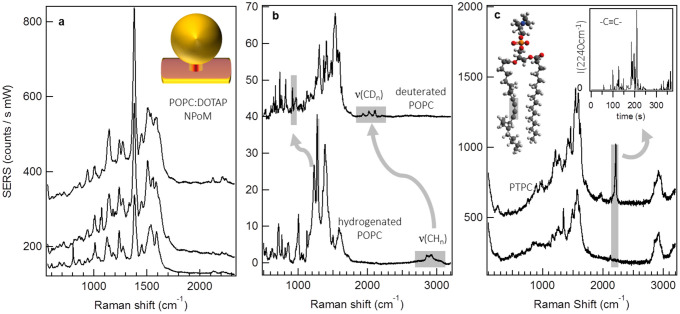
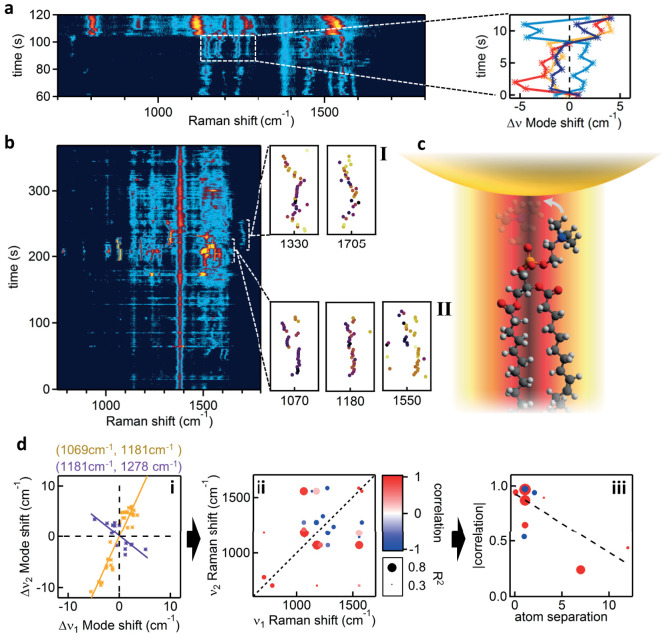
Interrogating individual molecules within bio-membranes is key to deepening our understanding of biological processes essential for life. Using Raman spectroscopy to map molecular vibrations is ideal to non-destructively 'fingerprint' biomolecules for dynamic information on their molecular structure, composition and conformation. Such tag-free tracking of molecules within lipid bio-membranes can directly connect structure and function. In this paper, stable co-assembly with gold nano-components in a 'nanoparticle-on-mirror' geometry strongly enhances the local optical field and reduces the volume probed to a few nm(3), enabling repeated measurements for many tens of minutes on the same molecules. The intense gap plasmons are assembled around model bio-membranes providing molecular identification of the diffusing lipids. Our experiments clearly evidence measurement of individual lipids flexing through telltale rapid correlated vibrational shifts and intensity fluctuations in the Raman spectrum. These track molecules that undergo bending and conformational changes within the probe volume, through their interactions with the environment. This technique allows for in situ high-speed single-molecule investigations of the molecules embedded within lipid bio-membranes. It thus offers a new way to investigate the hidden dynamics of cell membranes important to a myriad of life processes.
Figures
Similar articles
-
Plasmonic nanoantenna arrays for surface-enhanced Raman spectroscopy of lipid molecules embedded in a bilayer membrane.ACS Appl Mater Interfaces. 2014 Jun 25;6(12):8947-52. doi: 10.1021/am5023418. Epub 2014 Jun 12. ACS Appl Mater Interfaces. 2014. PMID: 24896979
-
Effect of functionalized gold nanoparticles on floating lipid bilayers.Langmuir. 2013 Jun 4;29(22):6606-14. doi: 10.1021/la401074y. Epub 2013 May 22. Langmuir. 2013. PMID: 23638939
-
Surface enhanced Raman spectroscopy of self-assembled layers of lipid molecules on nanostructured Au and Ag substrates.Chem Phys Lipids. 2017 Mar;203:12-18. doi: 10.1016/j.chemphyslip.2017.01.001. Epub 2017 Jan 6. Chem Phys Lipids. 2017. PMID: 28069393
-
Advances in surface-enhanced Raman spectroscopy (SERS) substrates for lipid and protein characterization: sensing and beyond.Analyst. 2018 Aug 20;143(17):3990-4008. doi: 10.1039/c8an00606g. Analyst. 2018. PMID: 30059080 Review.
-
Plasmonic Nanoparticle-Interfaced Lipid Bilayer Membranes.Acc Chem Res. 2019 Oct 15;52(10):2793-2805. doi: 10.1021/acs.accounts.9b00327. Epub 2019 Sep 25. Acc Chem Res. 2019. PMID: 31553568 Review.
Cited by
-
Cascaded nanooptics to probe microsecond atomic-scale phenomena.Proc Natl Acad Sci U S A. 2020 Jun 30;117(26):14819-14826. doi: 10.1073/pnas.1920091117. Epub 2020 Jun 15. Proc Natl Acad Sci U S A. 2020. PMID: 32541027 Free PMC article.
-
Reproducible Ultrahigh SERS Enhancement in Single Deterministic Hotspots Using Nanosphere-Plane Antennas Under Radially Polarized Excitation.Sci Rep. 2016 Sep 13;6:33218. doi: 10.1038/srep33218. Sci Rep. 2016. PMID: 27621109 Free PMC article.
-
Structure and Interaction of Ceramide-Containing Liposomes with Gold Nanoparticles as Characterized by SERS and Cryo-EM.J Phys Chem C Nanomater Interfaces. 2022 Aug 11;126(31):13237-13246. doi: 10.1021/acs.jpcc.2c01930. Epub 2022 Jul 27. J Phys Chem C Nanomater Interfaces. 2022. PMID: 35983312 Free PMC article.
-
Out-of-Plane Nanoscale Reorganization of Lipid Molecules and Nanoparticles Revealed by Plasmonic Spectroscopy.J Phys Chem Lett. 2020 Apr 16;11(8):2875-2882. doi: 10.1021/acs.jpclett.0c00182. Epub 2020 Mar 30. J Phys Chem Lett. 2020. PMID: 32191487 Free PMC article.
-
Probing Membrane Receptor-Ligand Specificity with Surface- and Tip- Enhanced Raman Scattering.Anal Chem. 2017 Sep 5;89(17):9091-9099. doi: 10.1021/acs.analchem.7b01796. Epub 2017 Aug 22. Anal Chem. 2017. PMID: 28805059 Free PMC article.
References
-
- Sprong H., Sluijs P. Der & Van G. How proteins move lipids and lipids move proteins. Nat Rev Mol Cell Biol. 2, 504–513 (2001). - PubMed
-
- Baumgart T., Hess S. T. & Webb W. W. Imaging coexisting fluid domains in biomembrane models coupling curvature and line tension. Nature 425, 821–824 (2003). - PubMed
-
- Edidin M. Lipids on the frontier: a century of cell-membrane bilayers. Nat. Rev. Mol. Cell Biol. 4, 414–418 (2003). - PubMed
Publication types
MeSH terms
Substances
Grants and funding
LinkOut - more resources
Full Text Sources
Other Literature Sources
Miscellaneous
