

FAK and paxillin dynamics at focal adhesions in the protrusions of migrating cells
- PMID: 25113375
- PMCID: PMC4129417
- DOI: 10.1038/srep06024
FAK and paxillin dynamics at focal adhesions in the protrusions of migrating cells
Abstract
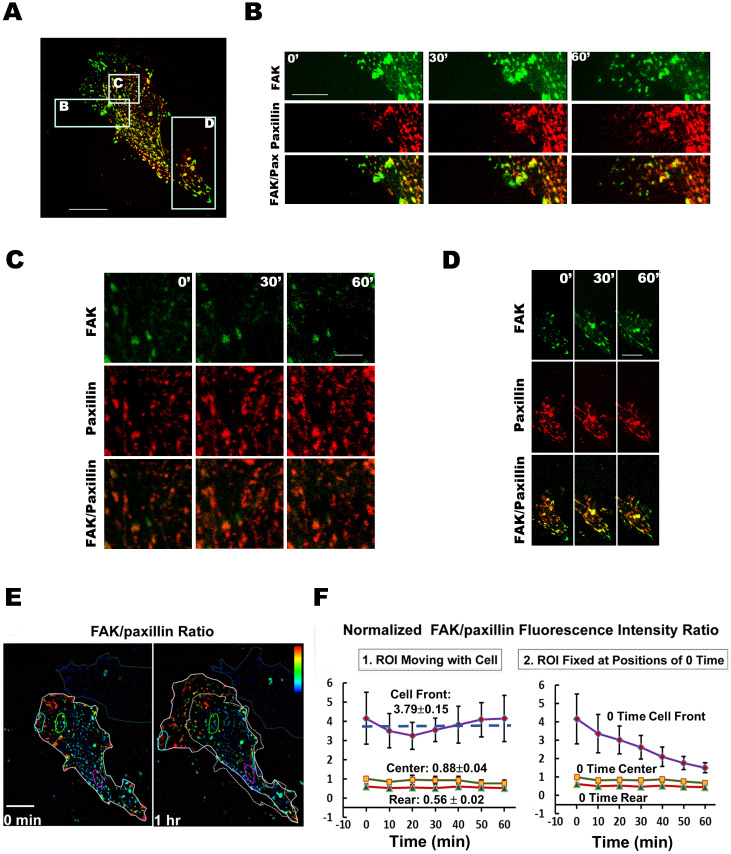
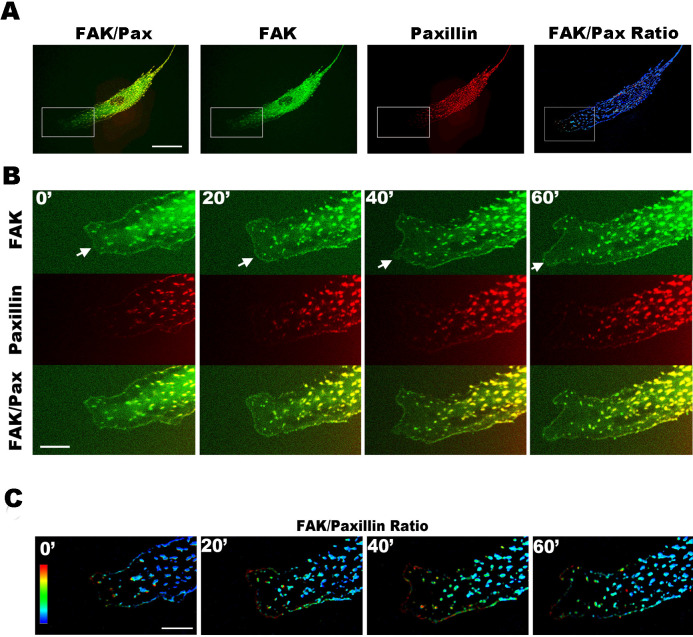
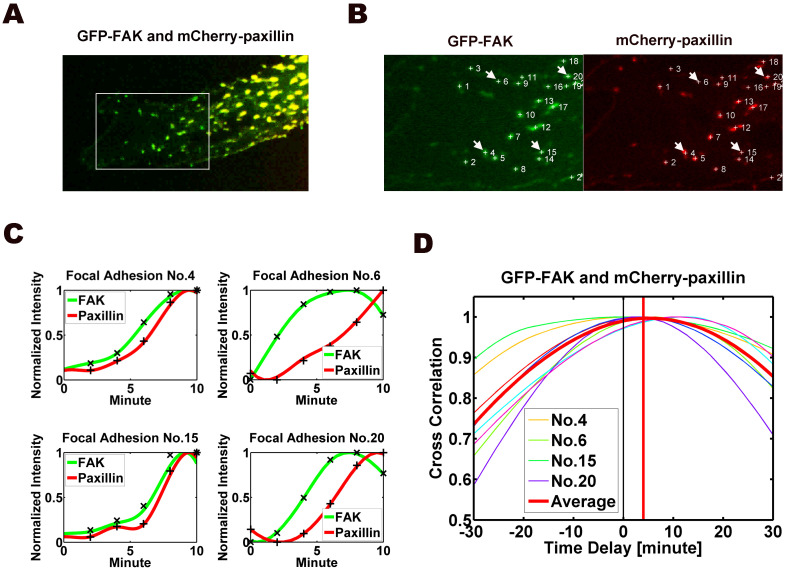
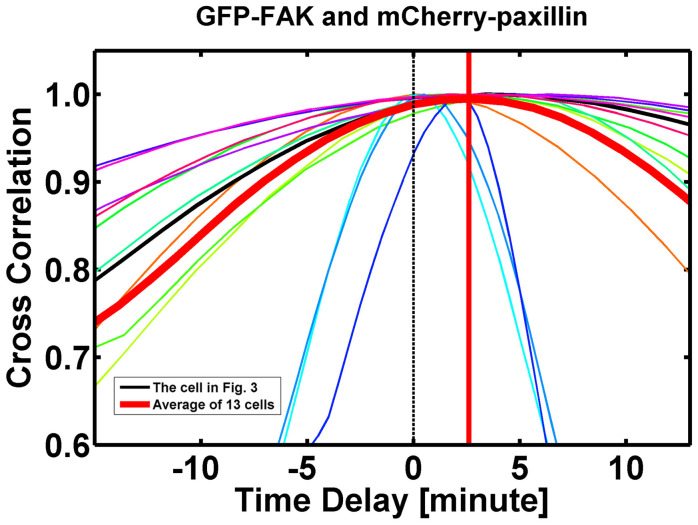
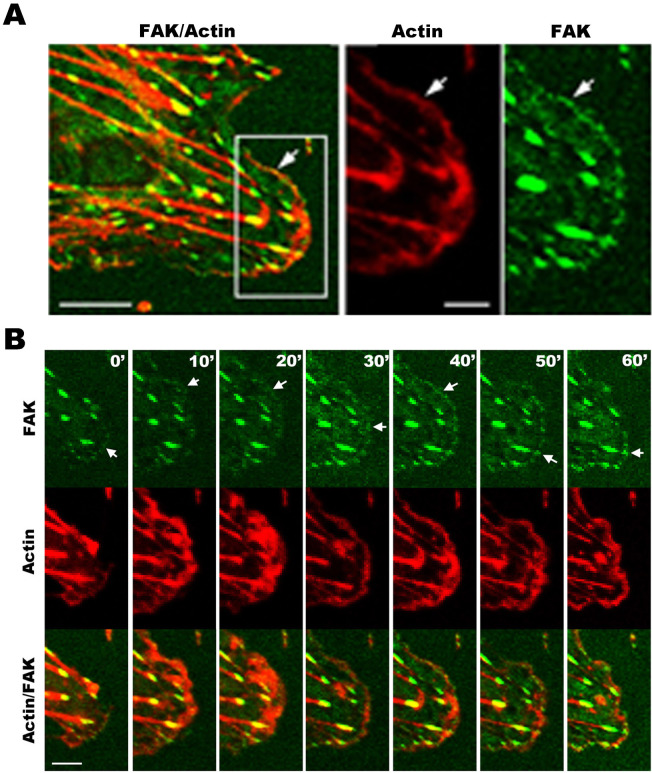
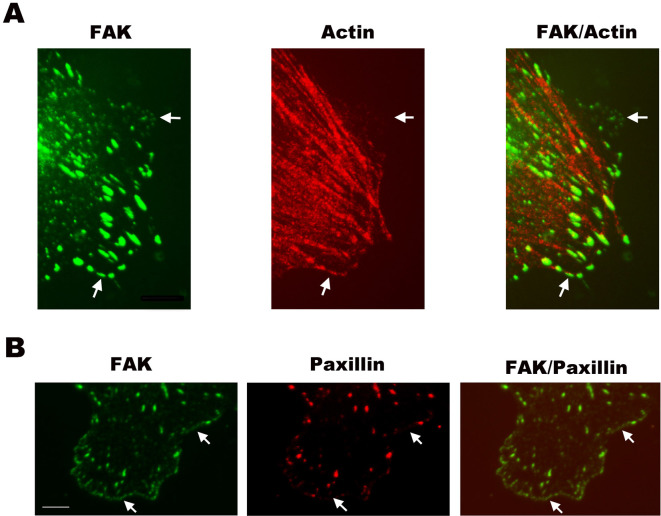
Cell migration requires the fine spatiotemporal integration of many proteins that regulate the fundamental processes that drive cell movement. Focal adhesion (FA) dynamics is a continuous process involving coordination between FA and actin cytoskeleton, which is essential for cell migration. We studied the spatiotemporal relationship between the dynamics of focal adhesion kinase (FAK) and paxillin at FAs in the protrusion of living endothelial cells. Concurrent dual-color imaging showed that FAK was assembled at FA first, which was followed by paxillin recruitment to the FA. By tracking and quantifying FAK and paxillin in migrating cells, the normalized FAK/Paxillin fluorescence intensity (FI) ratio is > 1 (≈ 4 fold) at cell front, ≈ 1 at cell center, and < 1 at cell rear. The significantly higher FAK FI than paxillin FI at cell front indicates that the assembly of FAK-FAs occurs ahead of paxillin at cell front. To determine the time difference between the assemblies of FAK and paxillin at nascent FAs, FAs containing both FAK and paxillin were quantified by image analysis and time correlation. The results show that FAK assembles at the nascent FAs earlier than paxillin in the protrusions at cell front.
Figures
Similar articles
-
FAK displacement from focal adhesions: a promising strategy to target processes implicated in cancer progression and metastasis.Cell Commun Signal. 2021 Jan 7;19(1):3. doi: 10.1186/s12964-020-00671-1. Cell Commun Signal. 2021. PMID: 33413438 Free PMC article.
-
FAK phosphorylation at Tyr-925 regulates cross-talk between focal adhesion turnover and cell protrusion.Mol Biol Cell. 2011 Apr;22(7):964-75. doi: 10.1091/mbc.E10-08-0725. Epub 2011 Feb 2. Mol Biol Cell. 2011. PMID: 21289086 Free PMC article.
-
The residence time of focal adhesion kinase (FAK) and paxillin at focal adhesions in renal epithelial cells is determined by adhesion size, strength and life cycle status.J Cell Sci. 2012 Oct 1;125(Pt 19):4498-506. doi: 10.1242/jcs.104273. Epub 2012 Jul 5. J Cell Sci. 2012. PMID: 22767508
-
New insights into FAK structure and function in focal adhesions.J Cell Sci. 2022 Oct 15;135(20):jcs259089. doi: 10.1242/jcs.259089. Epub 2022 Oct 14. J Cell Sci. 2022. PMID: 36239192 Review.
-
Asymmetric focal adhesion disassembly in motile cells.Curr Opin Cell Biol. 2008 Feb;20(1):85-90. doi: 10.1016/j.ceb.2007.10.009. Curr Opin Cell Biol. 2008. PMID: 18083360 Review.
Cited by
-
The role of RHAMM in cancer: Exposing novel therapeutic vulnerabilities.Front Oncol. 2022 Aug 10;12:982231. doi: 10.3389/fonc.2022.982231. eCollection 2022. Front Oncol. 2022. PMID: 36033439 Free PMC article. Review.
-
Zyxin Is Involved in Fibroblast Rigidity Sensing and Durotaxis.Front Cell Dev Biol. 2021 Nov 18;9:735298. doi: 10.3389/fcell.2021.735298. eCollection 2021. Front Cell Dev Biol. 2021. PMID: 34869319 Free PMC article.
-
Mitotic Centromere-Associated Kinesin (MCAK/KIF2C) Regulates Cell Migration and Invasion by Modulating Microtubule Dynamics and Focal Adhesion Turnover.Cancers (Basel). 2021 Nov 12;13(22):5673. doi: 10.3390/cancers13225673. Cancers (Basel). 2021. PMID: 34830827 Free PMC article.
-
The SHCA adapter protein cooperates with lipoma-preferred partner in the regulation of adhesion dynamics and invadopodia formation.J Biol Chem. 2020 Jul 31;295(31):10535-10559. doi: 10.1074/jbc.RA119.011903. Epub 2020 Apr 16. J Biol Chem. 2020. PMID: 32299913 Free PMC article.
-
β1-Integrin-Mediated Adhesion Is Lipid-Bilayer Dependent.Biophys J. 2017 Sep 5;113(5):1080-1092. doi: 10.1016/j.bpj.2017.07.010. Biophys J. 2017. PMID: 28877491 Free PMC article.
References
-
- Vicente-Manzanares M. & Horwitz A. R. Cell migration: an overview. Methods Mol Biol 769, 1–24 (2011). - PubMed
-
- Gupton S. L. & Waterman-Storer C. M. Spatiotemporal feedback between actomyosin and focal-adhesion systems optimizes rapid cell migration. Cell 125, 1361–1374 (2006). - PubMed
-
- McLean G. W. et al. The role of focal-adhesion kinase in cancer - a new therapeutic opportunity. Nat Rev Cancer 5, 505–515 (2005). - PubMed
Publication types
MeSH terms
Substances
Grants and funding
LinkOut - more resources
Full Text Sources
Other Literature Sources
Research Materials
Miscellaneous
