Review
. 2014 Nov;11(11):670-80.
doi: 10.1038/nrclinonc.2014.134. Epub 2014 Aug 12.

Quantitative multimodality imaging in cancer research and therapy

Affiliations
Review

Quantitative multimodality imaging in cancer research and therapy

Thomas E Yankeelov et al. Nat Rev Clin Oncol. 2014 Nov.

Abstract

Advances in hardware and software have enabled the realization of clinically feasible, quantitative multimodality imaging of tissue pathophysiology. Earlier efforts relating to multimodality imaging of cancer have focused on the integration of anatomical and functional characteristics, such as PET-CT and single-photon emission CT (SPECT-CT), whereas more-recent advances and applications have involved the integration of multiple quantitative, functional measurements (for example, multiple PET tracers, varied MRI contrast mechanisms, and PET-MRI), thereby providing a more-comprehensive characterization of the tumour phenotype. The enormous amount of complementary quantitative data generated by such studies is beginning to offer unique insights into opportunities to optimize care for individual patients. Although important technical optimization and improved biological interpretation of multimodality imaging findings are needed, this approach can already be applied informatively in clinical trials of cancer therapeutics using existing tools. These concepts are discussed herein.


Conflict of interest statement

Competing interests

T.E.Y. has been a consultant for Eli Lilly.

R.G.A. and C.C.Q. declare no competing interests.

Figures

Figure 1
Figure 1
Multimodality imaging in the diagnosis of metastasis in an 82-year-old woman with non-small-cell lung cancer. a | An axial attenuation-corrected FDG-PET image, which reveals a hypermetabolic focus in the right hemipelvis that is suggestive of a metastatic lesion, but is difficult to localize anatomically. b | A corresponding unenhanced axial CT image obtained using bone-window settings reveals a subtle focus of sclerosis in the right ischial tuberosity (arrow); this anomaly is difficult to identify in the absence of the PET image and cannot be definitively characterized based on the CT findings alone. c | A merged PET–CT image combines functional information from PET imaging with anatomical information from CT imaging, enabling conclusively definition of the lesion as a metastasis of the right ischial tuberosity. Abbreviation: FDG-PET, 2-18F-fluoro-2-deoxy-D-glucose PET.
Figure 2
Figure 2
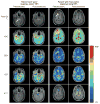
A multiparametric MRI evaluation of patients with high-grade glioma before and after anti-VEGF-A antibody therapy with bevacizumab. Images from pretreatment and post-treatment MRI assessment (2 weeks after the first infusion of bevacizumab) are shown for a patient with a poor response to treatment (‘short TTP’; 2.6 months) and for a patient who showed a favourable therapeutic response (‘long TTP’; >9 months). The post-gadolinium contrast-enhanced T1-weighted images (post-Gd T1) reveal a larger decrease in the enhancing tumour volume after a single infusion of bevacizumab in the patient with a favourable response to therapy. Both patients showed a moderate (~10%) decrease in mean tumour ADC, which was probably associated with the resolution of oedema. In the patient with the favourable response mean CBV and mean CBF decreased by 44% and 55%, respectively, 2 weeks after treatment; these decreases were larger than those observed in the patient with a poor response (30% and 22%, respectively). A smaller relative change in Ktrans was observed in the patient with the favourable response compared with patient with a poor response, although the mean baseline value of Ktrans was considerably higher in the patient with the shorter TTP (Ktrans=0.278min−1) than the patient with the longer TTP (Ktrans=0.107min−1). Given that a tumour’s cellular and vascular response to antiangiogenic therapy might not be temporally correlated and could vary dissimilarly, the serial assessment of each characteristic could prove to be highly useful in tracking and predicting therapeutic response as each metric provides a unique insight into the underlying tumour biology. Abbreviations: ADC, apparent diffusion coefficient; CBF, cerebral blood flow; CBV, cerebral blood volume; Ktrans, volume transfer constant of contrast agent between the blood and the extravascular extracellular space; TTP, time-to-progression; VEGF-A, vascular endothelial growth factor A.
Figure 3
Figure 3
PET–MRI in the evaluation of treatment response in breast cancer. The top row displays kep = (K trans/ve) maps overlain on a sagittal T1-weighted MRI of a woman with an invasive ductal carcinoma at baseline before treatment (left panel), after one cycle of neoadjuvant chemotherapy (middle panel), and at the conclusion of chemotherapy (right panel). kep represents the rate at which the contrast agent moves from the extravascular extracellular space back into the vascular space and a high kep value is indicative of malignancy. Note the increase in the number of red voxels observed after one cycle of chemotherapy (specifically, kep increased 32%, from 0.34 min−1 to 0.45 min−1) which indicates an increase in tumour aggressiveness. Conversely, the SUL of 18F-fluorodeoxyglucose during PET decreased by 30%, from 1.81 at baseline (bottom left panel) to 1.39 (bottom right panel) after one cycle of chemotherapy, indicating a possible reduction in metabolic activity; this finding argues against increased tumour aggressiveness. These apparently disparate findings indicate the potential importance of assessments that incorporate data from multimodality imaging, as well as potential complications that can arise during interpretation of such diverse parameters. That is, although such approaches can enable characterization of complementary aspects of tumour biology, substantial work is needed to determine the appropriate methods of synthesizing such data that ultimately provide the maximum benefit for patients. For this particular patient there was no residual tumour at the time of surgery (the patient achieved a pathological complete response) as seen by the images in the far right column, which were acquired within 1 week of surgery. Abbreviations: Ktrans, volume transfer constant of contrast agent between the blood and the extravascular extracellular space; SUL, standardized uptake value normalized to lean body mass; ve, fractional volume of the extravascular extracellular space.

Similar articles

Cited by

References

    1. Pisano ED, et al. Diagnostic performance of digital versus film mammography for breast-cancer screening. N Engl J Med. 2005;353:1773–1783. - PubMed
    1. Carmeliet P, Jain RK. Angiogenesis in cancer and other diseases. Nature. 2000;407:249–257. - PubMed
    1. Yankeelov TE, Gore JC. Dynamic-contrast enhanced magnetic resonance imaging in oncology: theory, data acquisition, analysis, and examples. Curr Med Imaging Rev. 2009;3:91–107. - PMC - PubMed
    1. Ingrisch M, Sourbron S. Tracer-kinetic modeling of dynamic contrast-enhanced MRI and CT: a primer. J Pharmacokinet Pharmacodyn. 2013;40:281–300. - PubMed
    1. Cosgrove D, Lassau N. Imaging of perfusion using ultrasound. Eur J Nucl Med Mol Imaging. 2010;37(Suppl 1):S65–S85. - PubMed

MeSH terms