. 2014 Aug 25;211(9):1793-805.
doi: 10.1084/jem.20131902. Epub 2014 Aug 11.

Dissecting the complement pathway in hepatic injury and regeneration with a novel protective strategy

Affiliations

Dissecting the complement pathway in hepatic injury and regeneration with a novel protective strategy

Keely M Marshall et al. J Exp Med. .

Abstract

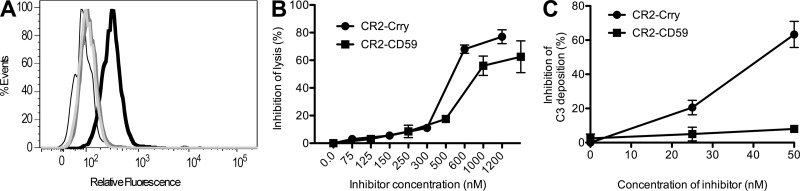
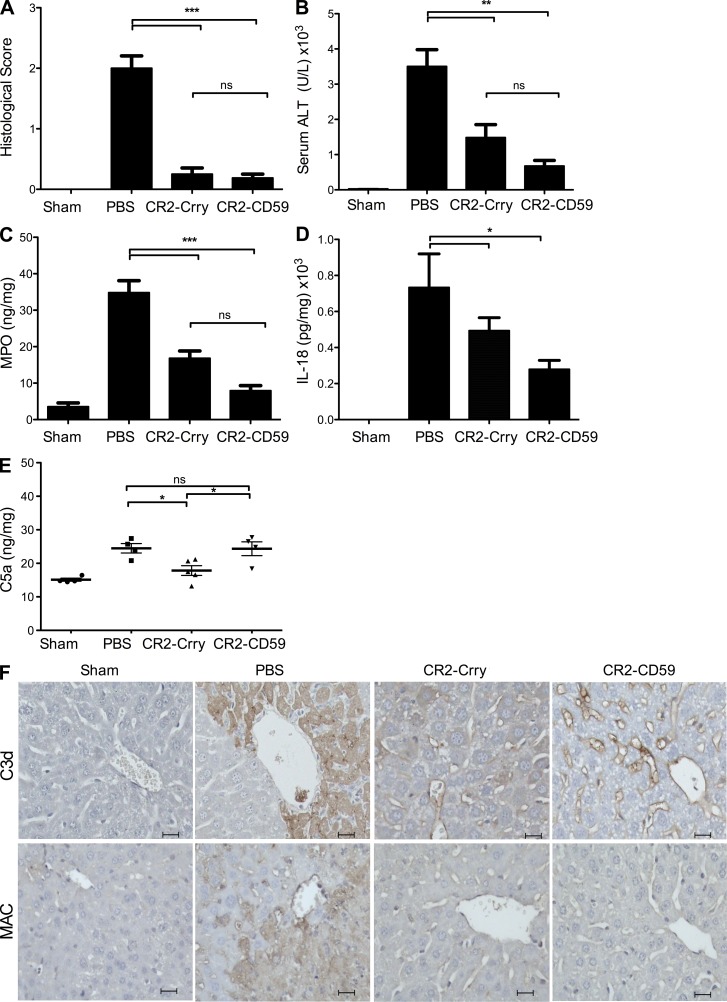
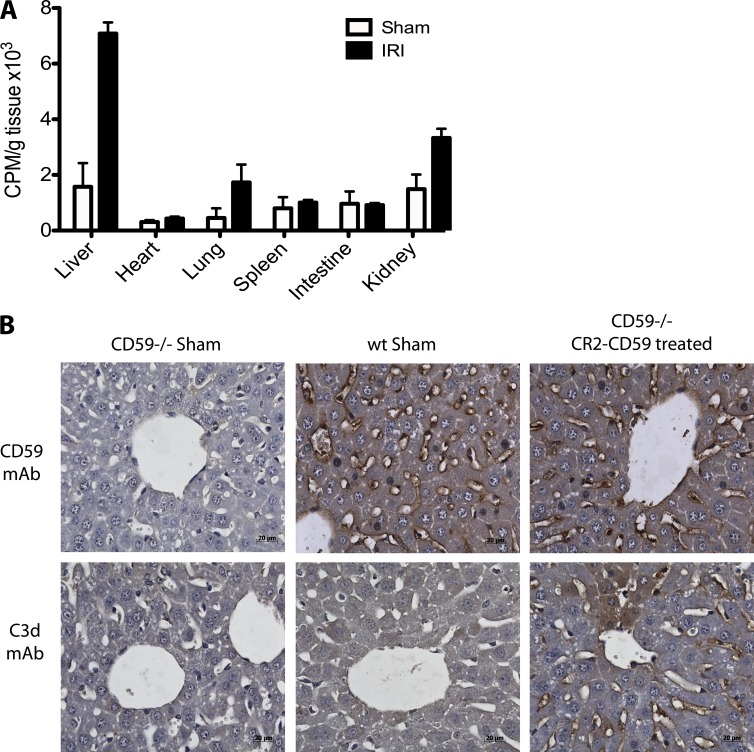
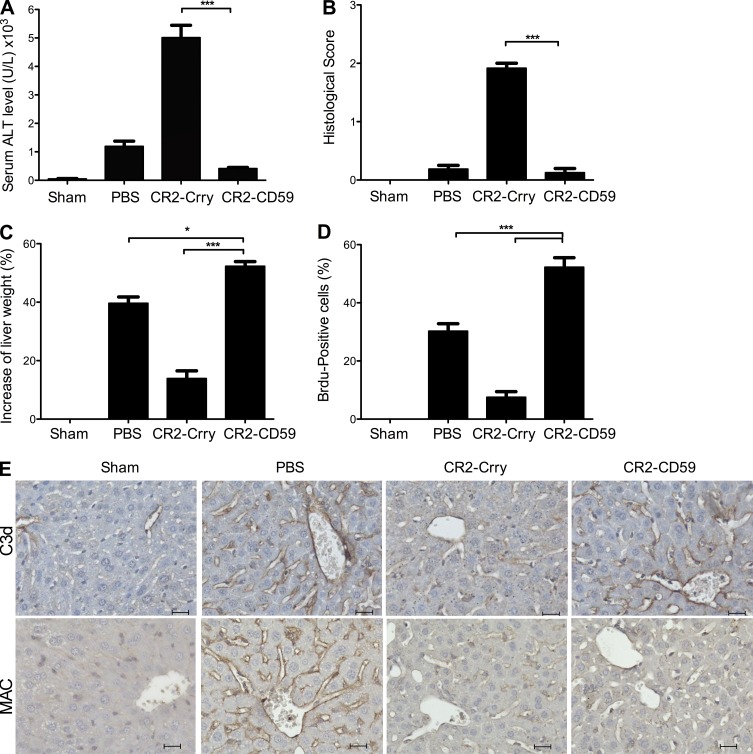
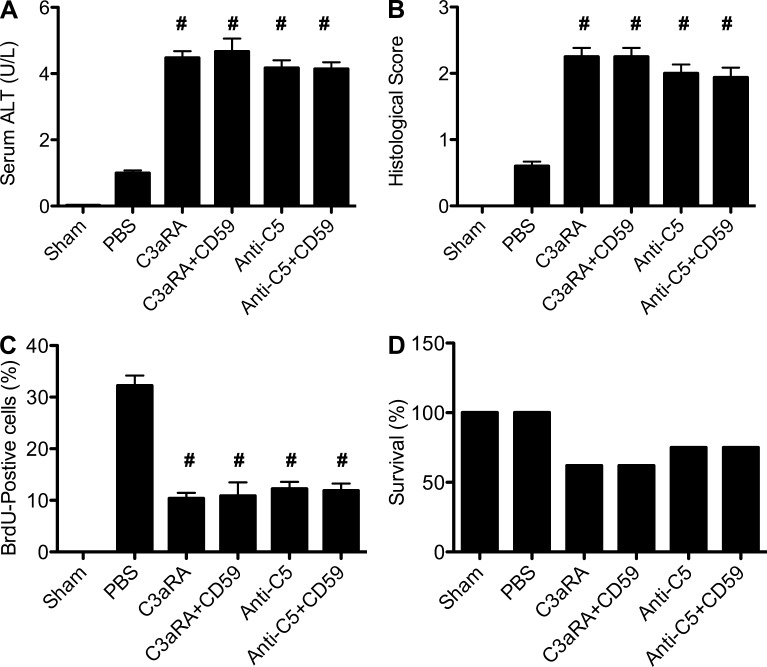
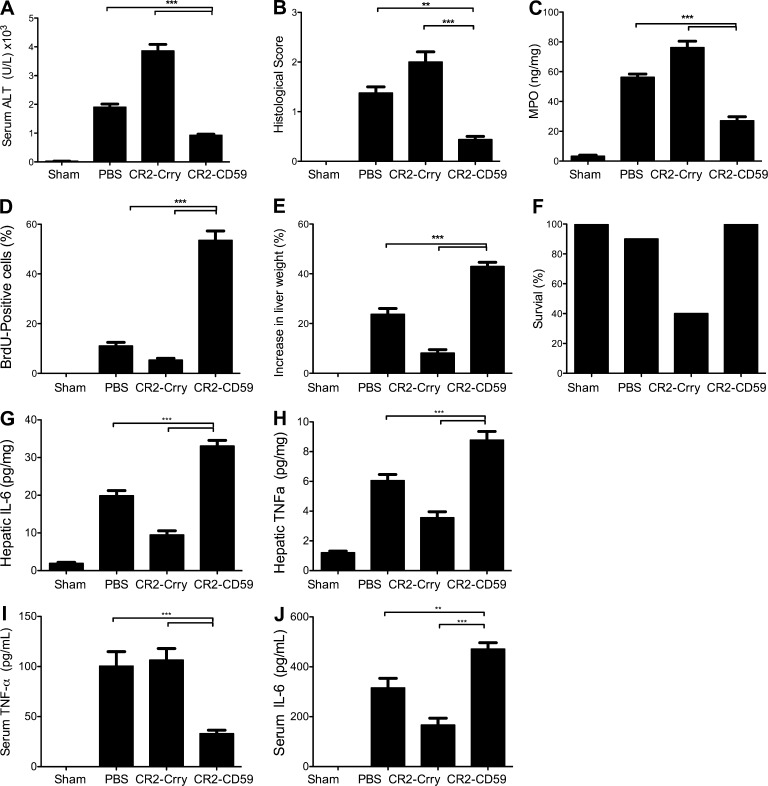
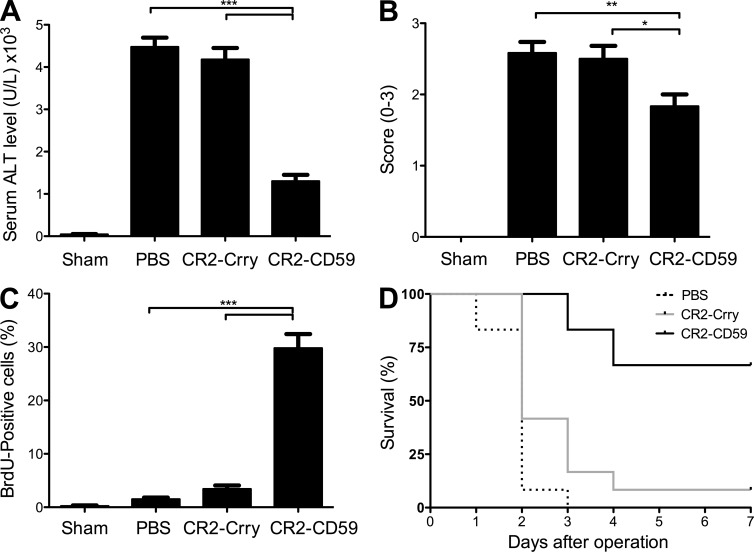
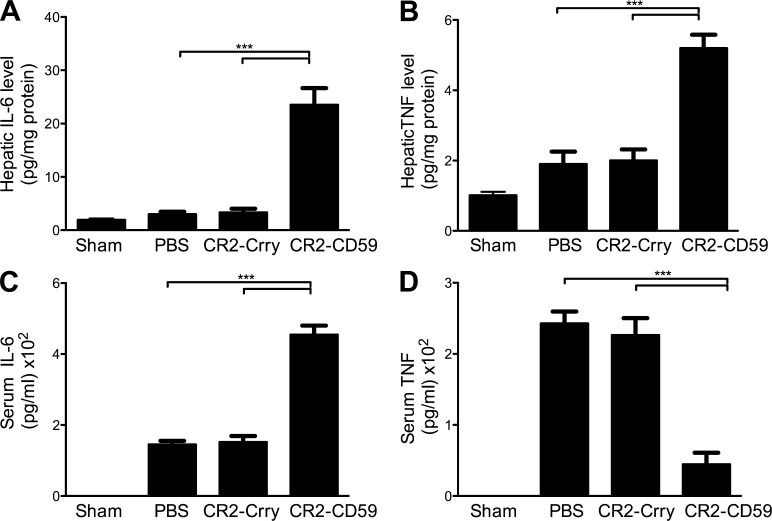
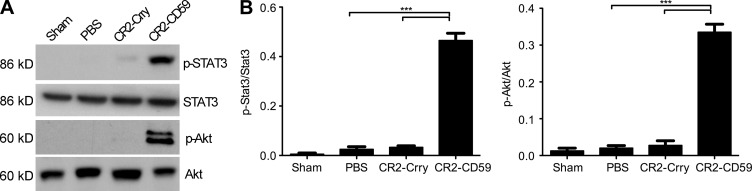
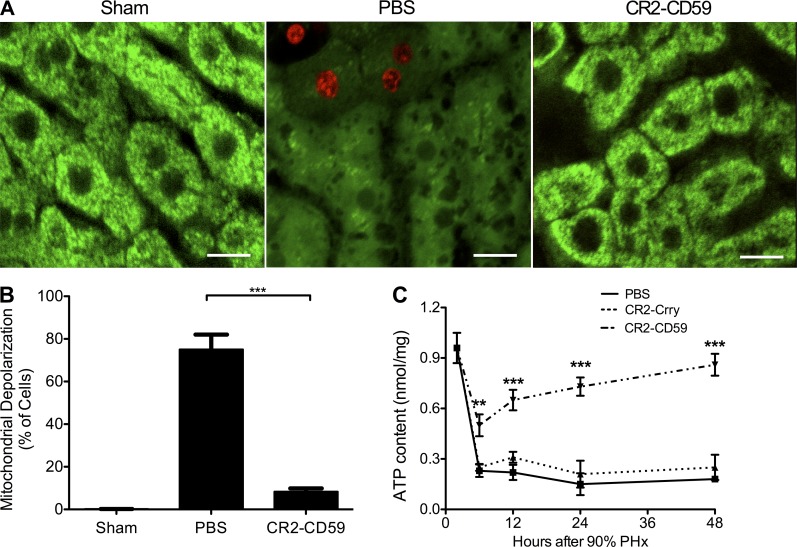
Liver resection is commonly performed under ischemic conditions, resulting in two types of insult to the remnant liver: ischemia reperfusion injury (IRI) and loss of liver mass. Complement inhibition is recognized as a potential therapeutic modality for IRI, but early complement activation products are also essential for liver regeneration. We describe a novel site-targeted murine complement inhibitor, CR2-CD59, which specifically inhibits the terminal membrane attack complex (MAC), and we use this protein to investigate the complement-dependent balance between liver injury and regeneration in a clinical setting of pharmacological inhibition. CR2-CD59 did not impact in vivo generation of C3 and C5 activation products but was as effective as the C3 activation inhibitor CR2-Crry at ameliorating hepatic IRI, indicating that the MAC is the principle mediator of hepatic IRI. Furthermore, unlike C3 or C5 inhibition, CR2-CD59 was not only protective but significantly enhanced hepatocyte proliferation after partial hepatectomy, including when combined with ischemia and reperfusion. Remarkably, CR2-CD59 also enhanced regeneration after 90% hepatectomy and improved long-term survival from 0 to 70%. CR2-CD59 functioned by increasing hepatic TNF and IL-6 levels with associated STAT3 and Akt activation, and by preventing mitochondrial depolarization and allowing recovery of ATP stores.


Figures

Figure 1.
Figure 1.
In vitro characterization of CR2-CD59. (A) Flow cytometric analysis of CR2-CD59 binding to C3-opsonized CHO cells. Antibody-sensitized CHO cells were incubated with C6−/− mouse serum followed by incubation with CR2-CD59 (thick black trace) or PBS (dark gray trace). CR2-CD59 was also incubated with unopsonized cells, either without antibody (light gray trace) or without serum (thin black trace). Shown is a representative of 3 separate experiments. (B) CR2-CD59 inhibition of complement-mediated RBC lysis. Antibody-sensitized chicken RBCs were incubated with either CR2-Crry or CR2-CD59 in the presence of mouse serum. (C) Effect of CR2-CD59 on C3 activation. Activated zymosan particles were incubated with mouse serum and increasing doses of CR2-Crry or CR2-CD59, and C3 deposition on particles detected by flow cytometry. Data are presented as mean ± SEM (n = 2–3) and are representative of 2–4 independent experiments.
Figure 2.
Figure 2.
Effect of CR2-CD59 and CR2-Crry on outcomes after hepatic IRI. Mice were subjected to 30 min of total warm ischemia and treated with PBS, CR2-Crry, or CR2-CD59 upon reperfusion. (A) Histological quantification of hepatic necrosis and injury in H&E-stained sections, scored on a scale of 0–3. Samples obtained 6 h after reperfusion. (B) Serum ALT levels in samples obtained 6 h after reperfusion. (C) Hepatic tissue levels of MPO measured 24 h after reperfusion by ELISA. (D) Hepatic tissue levels of IL-18 measured 24 h after reperfusion by ELISA. (E) Hepatic C5a levels 24 h after reperfusion. All ELISA measurements were normalized to total protein content. For A–E, results are expressed as mean ± SEM (n = 4–9) and are representative of 2–3 independent experiments; ***, P < 0.001; **, P < 0.01; *, P < 0.05; ns = not significant, assessed by ANOVA. (F) C3d and MAC deposition 24 h after reperfusion. Shown are representative images of immunostained liver sections, with 4 animals analyzed per group. Bars, 20 µM.
Figure 3.
Figure 3.
Biodistribution and localization of CR2-CD59 after hepatic IRI. (A) Biodistribution of CR2-CD59 after IRI. 125I-labeled CR2-CD59 was injected into mice immediately after IR or after a sham operation, and tissue distribution of radiolabel was assessed after 2 h reperfusion. Shown are the combined results from 3 independent experiments of 1 mouse per group (mean ± SEM); *, P < 0.05 versus all other samples, as assessed by ANOVA. (B) Hepatic localization of C3d and CR2-CD59 after IRI. CR2-CD59 was injected into WT or CD59−/− mice immediately after IR or after a sham operation, and livers were isolated after 2 h reperfusion. Serial sections were prepared and analyzed by immunohistochemistry for C3d and CR2-CD59 binding. Representative images, n = 3. Bars, 20 µM.
Figure 4.
Figure 4.
Effect of complement inhibition on outcomes after 70% PHx. Mice were treated with PBS, CR2-Crry, or CR2-CD59 immediately after surgery, and the following determinations were made 48 h after surgery. (A) Serum ALT. (B) Histological quantification of hepatic necrosis and injury in H&E-stained sections, scored on a scale of 0–3. (C) Liver weight restitution (D) Assessment of liver regeneration by BrdU incorporation, detected by immunohistochemistry and expressed as % positive cells in 10 high-power fields. Results are expressed as mean ± SEM (n = 4–6) and are representative of 3 independent experiments; ***, P < 0.001; *, P < 0.05, assessed by ANOVA. (E) Effect of CR2-Crry and CR2-CD59 on complement activation. C3d and MAC deposition was analyzed in sections prepared from livers isolated 48 h after surgery. Shown are representative images of immunostained liver sections, with 4 animals analyzed per group. Bars, 20 µM.
Figure 5.
Figure 5.
Effect of C3aRA, anti-C5 mAb, and CR2-CD59 treatment on outcome after 70 PHx. Mice were treated with C3aRA or anti-C5 mAb, with or without CR2-CD59 co-treatment, and the following determinations were made 48 h after surgery. (A) Serum ALT. (B) Histological quantification of hepatic necrosis and injury in H&E-stained sections (C) Assessment of liver regeneration by BrdU incorporation, detected by immunohistochemistry and expressed as % positive cells in 10 high-power fields. (D) Survival. Data are combined from 3 independent experiments (n = 8). Results for A–C are expressed as mean ± SEM. #, P > 0.05: no significant difference between any complement inhibitor–treated group, assessed by ANOVA.
Figure 6.
Figure 6.
Effect of complement inhibition on outcomes in a model incorporating both IRI and 70% PHx. Mice were treated with PBS, CR2-Crry, or CR2-CD59 immediately after combined surgery. (A) Serum ALT levels. (B) Histological quantification of hepatic necrosis and injury in H&E-stained sections. (C) Hepatic tissue levels of MPO. (D) Assessment of liver regeneration by BrdU incorporation. (E) Liver weight restitution. (F) Mouse survival. All determinations were made 48 h after surgery. (G–J) Hepatic and serum cytokines were measured by ELISA. (G) Hepatic IL-6 levels 3 h after surgery. (H) Hepatic TNF levels 3 h after surgery. (I) Serum IL-6 levels 6 h after surgery. (J) Serum TNF levels 6 h after surgery. Results are expressed as mean ± SEM (n = 4–6) and are representative of 3 independent experiments; ***, P < 0.001; **, P < 0.01, assessed by ANOVA.
Figure 7.
Figure 7.
CR2-CD59 protects against acute hepatic failure after 90% PHx. Mice were treated with PBS, CR2-Crry, or CR2-CD59 immediately after 90% PHx. (A) Serum ALT levels 6 h after surgery. (B) Histological quantification of hepatic necrosis and injury in H&E-stained sections, scored on a scale of 0–3. (C) Assessment of liver regeneration by BrdU incorporation, detected by immunohistochemistry and expressed as % positive cells counted in 10 high-power fields, determined 24 h after surgery. Results are expressed as mean ± SEM (n = 6) and are representative of 3 independent experiments; ***, P < 0.00; **, P < 0.01; *, P < 0.05, as assessed by ANOVA. (D) Survival analysis over a 7-d period after surgery. Difference between the CR2-CD59–treated group and CR2-Crry– or PBS-treated groups was statistically significant as determined by the Kaplan-Meier test (P < 0.05). Combined data from 2 independent experiments (n = 12).
Figure 8.
Figure 8.
Systemic and local cytokine production after 90% PHx. Mice were treated with PBS, CR2-Crry, or CR2-CD59 immediately after 90% PHx. Hepatic and serum cytokines were measured by ELISA, normalized to total protein content. (A) Hepatic IL-6 levels 3 h after surgery. (B) Hepatic TNF levels 3 h after surgery. (C) Serum IL-6 levels 6 h after surgery. (D) Serum TNF levels 6 h after surgery. Results are expressed as mean ± SEM (n = 4–6) and are representative of 3 independent experiments; ***, P < 0.00, as assessed by ANOVA.
Figure 9.
Figure 9.
Stat3 and Akt activation occurs in CR2-CD59–treated mice but not CR2-Crry–treated mice after 90% PHx. Mice were treated with PBS, CR2-Crry, or CR2-CD59 immediately after 90% PHx. (A) Representative Western blot of STAT3, p-STAT3, Akt, and p-Akt in liver homogenate at 3 h after surgery. (B) Densitometry. Results are expressed as mean ± SEM (n = 4–6) and are representative of 3 independent experiments; ***, P < 0.001, as assessed by ANOVA.
Figure 10.
Figure 10.
CR2-CD59 treatment prevents mitochondrial depolarization and promotes recovery of ATP stores after 90% PHx. Mice underwent 90% PHx or sham operation, and resected mice were treated with either PBS or CR2-CD59 immediately after surgery. For intravital microscopy study, live animals were infused intravascularly with Rh123 fluorescence and PI (live/dead) stain into the carotid artery 2 h after resection. (A) Representative confocal image of hepatic Rh123 (green) and PI (red). Bars, 10 µM. (B) Percentage of hepatocytes with depolarized mitochondria in 10 high-power fields. Shown are the combined results from 4 independent experiments of 1 mouse per group (mean ± SEM). (C) ATP content in liver tissue taken at different time points after 90% PHx. Results are expressed as mean ± SEM (n = 4–6) and are representative of 3 independent experiments; ***, P < 0.001; **, P < 0.01, as assessed by ANOVA.

References

    1. Amsterdam, E.A., Stahl G.L., Pan H.L., Rendig S.V., Fletcher M.P., and Longhurst J.C.. 1995. Limitation of reperfusion injury by a monoclonal antibody to C5a during myocardial infarction in pigs. Am. J. Physiol. 268:H448–H457. - PubMed
    1. Arumugam, T.V., Shiels I.A., Strachan A.J., Abbenante G., Fairlie D.P., and Taylor S.M.. 2003. A small molecule C5a receptor antagonist protects kidneys from ischemia/reperfusion injury in rats. Kidney Int. 63:134–142. 10.1046/j.1523-1755.2003.00737.x - DOI - PubMed
    1. Arumugam, T.V., Woodruff T.M., Stocks S.Z., Proctor L.M., Pollitt S., Shiels I.A., Reid R.C., Fairlie D.P., and Taylor S.M.. 2004. Protective effect of a human C5a receptor antagonist against hepatic ischaemia-reperfusion injury in rats. J. Hepatol. 40:934–941. 10.1016/j.jhep.2004.02.017 - DOI - PubMed
    1. Atkinson, C., Song H., Lu B., Qiao F., Burns T.A., Holers V.M., Tsokos G.C., and Tomlinson S.. 2005. Targeted complement inhibition by C3d recognition ameliorates tissue injury without apparent increase in susceptibility to infection. J. Clin. Invest. 115:2444–2453. 10.1172/JCI25208 - DOI - PMC - PubMed
    1. Bilzer, M., Roggel F., and Gerbes A.L.. 2006. Role of Kupffer cells in host defense and liver disease. Liver Int. 26:1175–1186. 10.1111/j.1478-3231.2006.01342.x - DOI - PubMed

Publication types

MeSH terms