. 2014 Nov;82(11):4477-86.
doi: 10.1128/IAI.01969-14. Epub 2014 Aug 11.

Polymorphonuclear leukocytes restrict growth of Pseudomonas aeruginosa in the lungs of cystic fibrosis patients

Affiliations

Polymorphonuclear leukocytes restrict growth of Pseudomonas aeruginosa in the lungs of cystic fibrosis patients

Kasper N Kragh et al. Infect Immun. 2014 Nov.

Abstract

Cystic fibrosis (CF) patients have increased susceptibility to chronic lung infections by Pseudomonas aeruginosa, but the ecophysiology within the CF lung during infections is poorly understood. The aim of this study was to elucidate the in vivo growth physiology of P. aeruginosa within lungs of chronically infected CF patients. A novel, quantitative peptide nucleic acid (PNA) fluorescence in situ hybridization (PNA-FISH)-based method was used to estimate the in vivo growth rates of P. aeruginosa directly in lung tissue samples from CF patients and the growth rates of P. aeruginosa in infected lungs in a mouse model. The growth rate of P. aeruginosa within CF lungs did not correlate with the dimensions of bacterial aggregates but showed an inverse correlation to the concentration of polymorphonuclear leukocytes (PMNs) surrounding the bacteria. A growth-limiting effect on P. aeruginosa by PMNs was also observed in vitro, where this limitation was alleviated in the presence of the alternative electron acceptor nitrate. The finding that P. aeruginosa growth patterns correlate with the number of surrounding PMNs points to a bacteriostatic effect by PMNs via their strong O2 consumption, which slows the growth of P. aeruginosa in infected CF lungs. In support of this, the growth of P. aeruginosa was significantly higher in the respiratory airways than in the conducting airways of mice. These results indicate a complex host-pathogen interaction in chronic P. aeruginosa infection of the CF lung whereby PMNs slow the growth of the bacteria and render them less susceptible to antibiotic treatment while enabling them to persist by anaerobic respiration.


Figures

FIG 1
FIG 1
Pseudomonas aeruginosa at different growth rates. The cells were treated with PNA-FISH probes targeting P. aeruginosa 16S rRNA. The specific growth rates, in divisions (div) per hour, are indicated on the panels.
FIG 2
FIG 2
Correlations between fluorescence intensity and rRNA or growth rate. (A) Correlation between the average fluorescence intensity in P. aeruginosa cells and the number of rRNA molecules per rRNA gene molecule, as measured by RT-PCR. The black line shows the calculated correlation, and the two dotted lines show the 95% confidence interval. The correlation has an R2 fit at 0.7222. The relationship is described by y = 0.0447 × x + 46.3. (B) Correlation between the average measured fluorescence intensity (FU) in P. aeruginosa and the growth rate determined from OD measurements of bacterial culture samples as a function of time. The black line shows the calculated correlation, and the two dotted lines show the 95% confidence interval. The correlation has an R2 fit at 0.7627. The relationship is described by y = (1.146 × 10⁻⁴) × x − 1.031.
FIG 3
FIG 3
Micrograph of P. aeruginosa-infected lung tissue. Light and fluorescence microscopy images (magnification, ×170) of periodic acid-Schiff- and hematoxylin-stained sections (A and B) and PNA-FISH-stained sections (C and D) containing luminal and mucosal accumulations of inflammatory cells. The P. aeruginosa-positive areas are seen as well-defined lobulated clarifications surrounded by inflammatory cells. Red arrows indicate PMNs, and green arrows indicate P. aeruginosa biofilm aggregates.
FIG 4
FIG 4
Growth rates measured in lung tissue and peak growth rate achieved by isolates. The specific growth rate of Pseudomonas aeruginosa was estimated by quantitative PNA-FISH in 59 biofilm aggregates in 20 tissue sections from explanted lungs from three CF patients (solid symbols). The highest exponential (exp) growth measurements from isolates are shown as open symbols. The horizontal line represents the median rate in each patient. Dates of sampling are indicated. pr, patient; **, P ≤ 0.01; ***, P ≤ 0.001.
FIG 5
FIG 5
Growth rates versus biofilm aggregate size. Growth rates measured in biofilm clusters in ex vivo CF lung tissue are shown as a function of size. There was no significant correlation between size and growth (P = 0.1891).
FIG 6
FIG 6
Growth rates measured in lung tissue as a function of the number of surrounding PMNs. The specific in vivo growth rate of Pseudomonas aeruginosa was estimated by quantitative PNA-FISH as a function of the total number of PMNs within a 20-μm radius from the edge of the 59 measured biofilm aggregates in 20 tissue sections of explanted lungs from three CF patients. There was a significant negative Spearmen's correlation (ρ = −0.4471, P ≤ 0.0004) between the specific growth rate and the number of PMNs in the surrounding mucus.
FIG 7
FIG 7
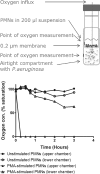
Oxygen consumption by PMNs measured in filter vial. The schematic drawing shows an in vitro experiment with PMNs in a chamber separated by a membrane from an airtight chamber containing P. aeruginosa (upper panel). O2 concentration (con) measurements taken in the chamber above the membrane or in the airtight chamber below the membrane were plotted versus time (lower panel). All measurements were done with PMNs (either unstimulated or stimulated with PMA) in the chamber above the membrane.
FIG 8
FIG 8
Effects of PMNs on P. aeruginosa growth in vitro. Changes in the growth rate of P. aeruginosa in the absence (Bac alone) or presence (Bac + PMN) of PMNs, untreated or supplemented with NO3, were determined. (A) Growth after 2 h of treatment. (B) Growth after 4 h of treatment. The growth rate was lower in P. aeruginosa samples with PMNs than in samples of P. aeruginosa alone. The effect of the PMNs could be alleviated by the addition of NO3. The horizontal line represents the median growth rate. ***, P < 0.001.
FIG 9
FIG 9
Growth rates of P. aeruginosa observed in mouse model. The specific in vivo growth rate of Pseudomonas aeruginosa was measured in the conducting or respiratory airways of seven mice by quantitative PNA-FISH (n = 34 single observations). The growth rate was significantly higher (P ≤ 0.0077) in respiratory airways than in conducting airways. The horizontal line represents the median growth rate. **, P ≤ 0.01.

References

    1. Koch C, Hoiby N. 2000. Diagnosis and treatment of cystic fibrosis. Respiration 67:239–247. 10.1159/000029503. - DOI - PubMed
    1. Hoiby N. 2011. Recent advances in the treatment of Pseudomonas aeruginosa infections in cystic fibrosis. BMC Med. 9:32. 10.1186/1741-7015-9-32. - DOI - PMC - PubMed
    1. Alhede M, Bjarnsholt T, Jensen PO, Phipps RK, Moser C, Christophersen L, Christensen LD, van Gennip M, Parsek M, Hoiby N, Rasmussen TB, Givskov M. 2009. Pseudomonas aeruginosa recognizes and responds aggressively to the presence of polymorphonuclear leukocytes. Microbiology 155:3500–3508. 10.1099/mic.0.031443-0. - DOI - PubMed
    1. Bjarnsholt T, Jensen PO, Fiandaca MJ, Pedersen J, Hansen CR, Andersen CB, Pressler T, Givskov M, Hoiby N. 2009. Pseudomonas aeruginosa biofilms in the respiratory tract of cystic fibrosis patients. Pediatr. Pulmonol. 44:547–558. 10.1002/ppul.21011. - DOI - PubMed
    1. Høiby N, Ciofu O, Johansen HK, Song ZJ, Moser C, Jensen PO, Molin S, Givskov M, Tolker-Nielsen T, Bjarnsholt T. 2011. The clinical impact of bacterial biofilms. Int. J. Oral Sci. 3:55–65. 10.4248/IJOS11026. - DOI - PMC - PubMed

Publication types

Substances