. 2014 Sep 23;111(38):13811-6.
doi: 10.1073/pnas.1324214111. Epub 2014 Aug 11.

Bioengineered functional brain-like cortical tissue

Affiliations

Bioengineered functional brain-like cortical tissue

Min D Tang-Schomer et al. Proc Natl Acad Sci U S A. .

Abstract

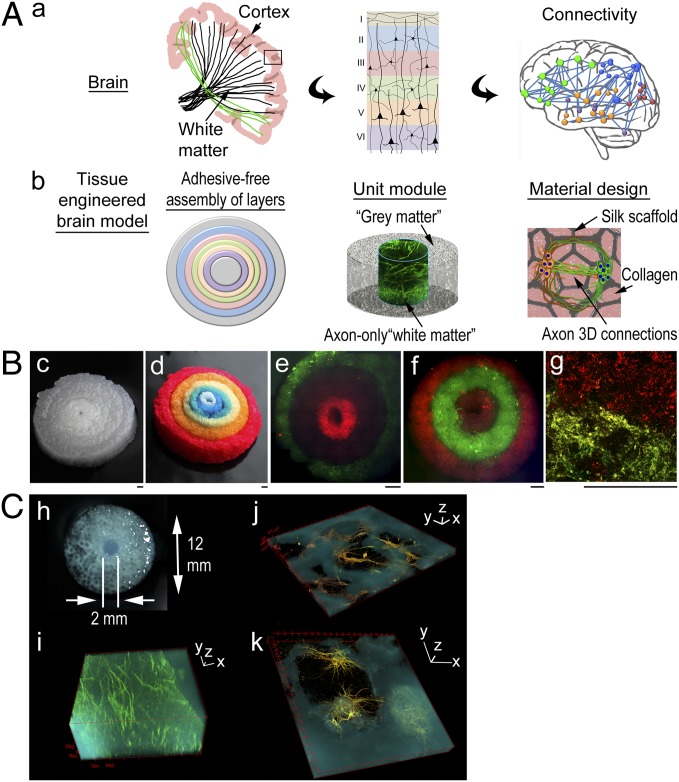
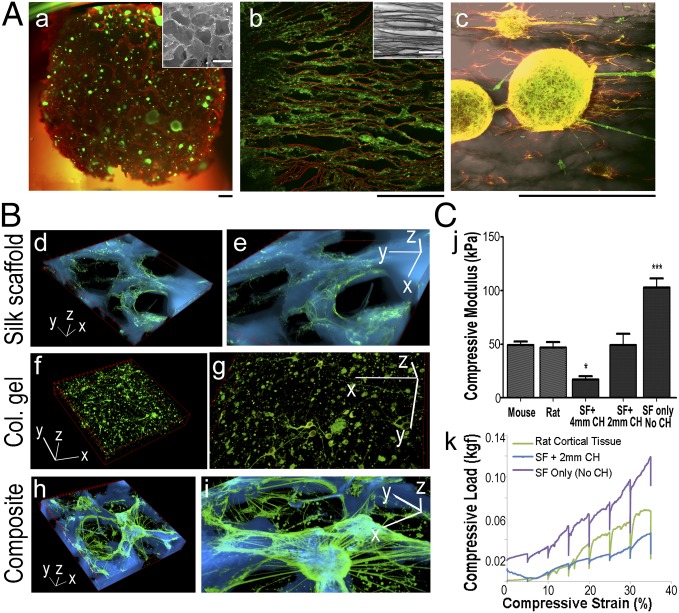
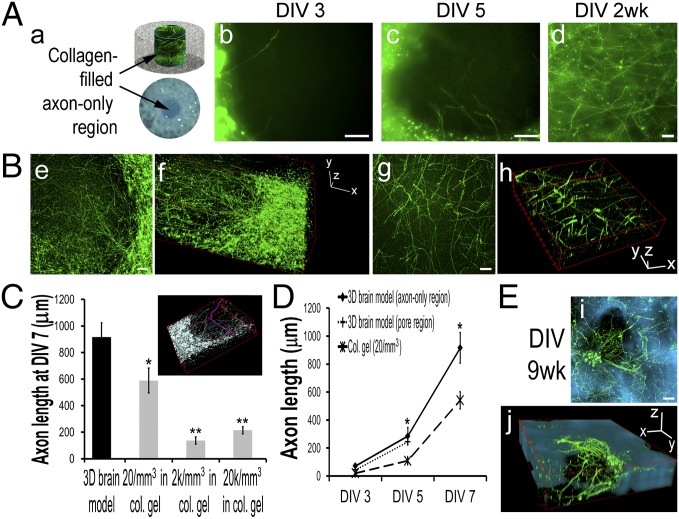
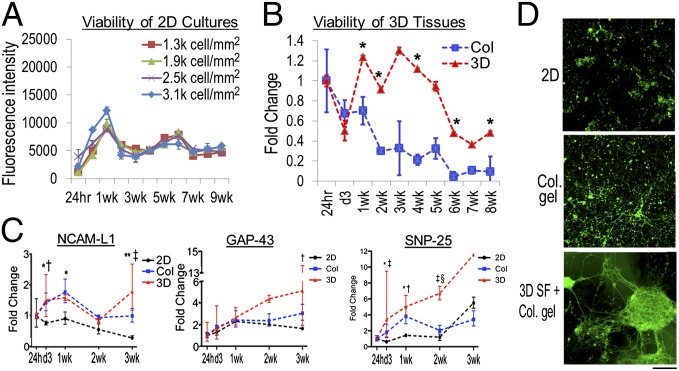
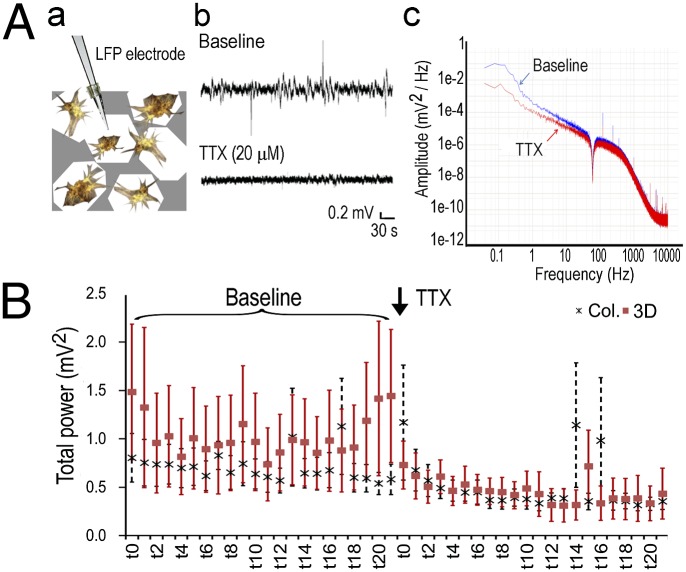
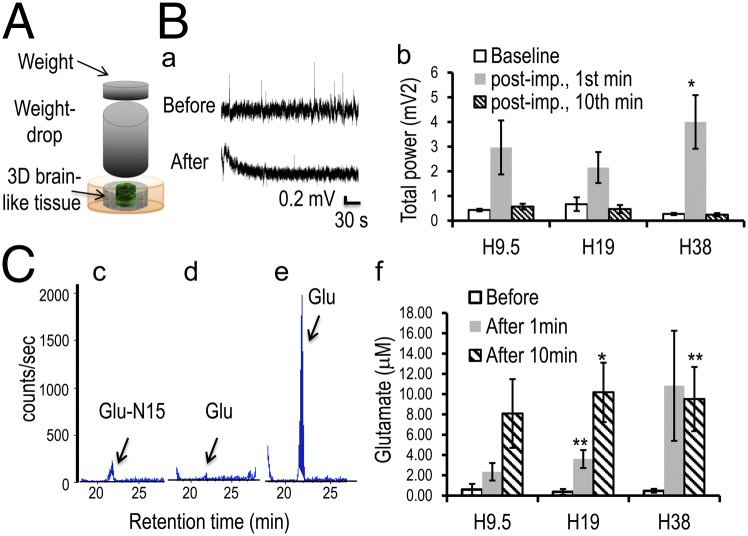
The brain remains one of the most important but least understood tissues in our body, in part because of its complexity as well as the limitations associated with in vivo studies. Although simpler tissues have yielded to the emerging tools for in vitro 3D tissue cultures, functional brain-like tissues have not. We report the construction of complex functional 3D brain-like cortical tissue, maintained for months in vitro, formed from primary cortical neurons in modular 3D compartmentalized architectures with electrophysiological function. We show that, on injury, this brain-like tissue responds in vitro with biochemical and electrophysiological outcomes that mimic observations in vivo. This modular 3D brain-like tissue is capable of real-time nondestructive assessments, offering previously unidentified directions for studies of brain homeostasis and injury.

Keywords: connectivity; electrophysiology; scaffold; silk; traumatic brain injury.


Conflict of interest statement

The authors declare no conflict of interest.

Figures

Fig. 1.
Fig. 1.
A modular design of bioengineered brain-like cortical tissues. (A) Schematics of the conceptual framework of the strategy. (a) Targeted architectural features of the brain: (Left) the cortex and white matter tracks (drawing based on diffuse tensor imaging photographs in ref. 14), (Center) six laminar layers of the neocortex, and (Right) white matter connectivity in microcircuitries (drawing based on connectivity analysis described in ref. 15). (b) The design concepts: (Left) adhesive-free assembly of concentrically arranged layers, (Center) the unit module consisting of neuron-rich grey matter regions and axon-only white matter regions, and (Right) the material design of scaffold/collagen gel composite supporting axon connections in 3D. (B) 3D assembled tissue structures. (c and d) Assembly of six concentrically shaped donuts of silk scaffold [(c) original color; (d) dyed with food color]. (e–g) Each layer was seeded with different primary rat cortical neurons (live-stained with DiI in red and DiO in green) and assembled: (e and f) two three-layered constructs and (g) neurons at the interface. (Scale bar: 1 mm.) (C) A unit module. (h) The scaffold. (i–k) Three-dimensional view of confocal z stack of multichannel images of 3D brain-like tissues (fluorescently stained with axonal marker β3-tubulin in green and dendritic marker microtubule-associated protein-2 in red and superposed with inverted bright-field images of silk structure in cyan). (i) The center axon-only region. (j and k) The porous scaffold region. Note that the extensive neuronal coverage on the scaffold surface is obscured by the opaqueness of the scaffold material (cyan) compared with the porous region (dark) in the 3D images. (Scale bars: 3D axis, 100 µm.)
Fig. 2.
Fig. 2.
Optimization of structure, matrix components, and mechanical stiffness for the brain-like tissue. (A) Structure. (a) Neurons (green) growing in silk sponges (red) with random pores (Inset; ∼500-µm diameter). (b and c) Neurons growing in silk sponges with aligned pores (b, Inset). (b) Live neuronal processes (green) growing along silk material structures (red). (c) Neurons (green) and glial cells (red) extend processes along aligned silk structures (dark gray). (Scale bar: 100 µm.) (B) Matrix components. (d and e) Silk scaffold only. (f and g) Collagen gel only. (h and i) Composite structures of silk scaffold infused with collagen gel. Fluorescence images of neurons (green) superposed with inverted bright-field images of silk structure (cyan). e, g, and i are zoomed-in views of d, f, and h, respectively. (Scale bars: 3D axis, 100 µm.) Col, collagen. (C) Mechanical stiffness measured by the confined compression test. SF, scaffold. (j) Compressive modulus of the composite structures with two different CH dimensions (2- and 4-mm CHs) compared with mouse and rat cortical tissues. Student t test. *P < 0.05; ***P < 0.001. (k) Representative load train traces.
Fig. 3.
Fig. 3.
Three-dimensional brain-like tissue growth. (A) Axon growth in the collagen gel-filled center region. DIV, days in vitro. (a) Schematics. (b–d) Fluorescence images of (b) DIV3, (c) DIV5, and (d) 2-wk axons immunostained with β3-tubulin in green. (Scale bar: 100 µm.) (B) Three-dimensional view of confocal z stacks of DIV7 axons in the center region (e is the summed projection of f; g is the summed projection of h). (Scale bar: 100 µm.) (C) Axon length at DIV7 (Inset shows D axon tracing in pink) (Materials and Methods): comparison of 3D brain-like tissue with collage gel-based cultures with different cell densities. Student t test, collagen (col.) vs. 3D brain model. *P < 0.05; **P < 0.01. (D) Axon length growth. (E) Representative fluorescence images of neurons in a scaffold pore at DIV9 wk (β3-tubulin–stained in green superposed on silk structures in cyan; i is the summed projection of j). (Scale bar: 100 µm.)
Fig. 4.
Fig. 4.
Three-dimensional brain-like tissue viability and gene expression. (A) Viability of 2D cultures measured with alamarBlue assay. Most cells died after 3 wk. (B) Viability of 3D brain-like tissues (red) and collagen (Col) gel-based cultures (blue) assayed with alamarBlue and expressed relative to 24-h levels. Student t test. *P < 0.05, 3D vs. Col. The two groups had similar cell numbers as determined from Fig. S3. (C) Expression of neural cell adhesion molecule L1 (NCAM-L1), growth-associated protein 43 (GAP-43), and synaptosomal-associated protein 25 (SNP-25) mRNA in 2D (black), collagen gel-based cultures (blue), and 3D brain-like tissues (red) over DIV3 wk relative to the 24-h expression. Asymmetric error bars show maximum and minimum fold change. Two-way ANOVA with Bonferroni posttests: 2D vs. Col: *P < 0.05; **P < 0.001; 2D vs. 3D: P < 0.05; P < 0.001; Col vs. 3D: §P < 0.05. (D) Representative fluorescence images of DIV21 neurons immunostained with β3-tubulin in green. (Scale bar: 100 µm.)
Fig. 5.
Fig. 5.
Three-dimensional brain-like tissue electrophysiological activities. (A) LFP measurement. (a) Schematics. (b) Representative signal traces of baseline and after TTX (20 µM) treatment. (c) A representative power spectrum after fast Fourier transformation of raw signal traces. (B) Time-evolved changes of total power (millivolts2; 0–50 Hz) over a 20-min duration (10 min of baseline and 10 min of TTX treatment). Each segment (t0–t20) represents a 27-s window. Col, collagen.
Fig. 6.
Fig. 6.
Three-dimensional brain-like tissue responses to TBI. (A) Schematics of the weight-drop impact injury model. (B) Injury-induced electrophysiological activity changes. (a) Representative signal traces of baseline (before) and after impact (after). The electrode was removed during injury and repositioned after an ∼2-min delay to avoid artifacts from the impact. (b) Total power of a 10-min baseline recording, the first 1-min postimpact, and minute 10 postimpact. Paired Student t test. *P < 0.05 vs. baseline. (C) Injury-triggered Glu release. Glu peaks (arrow) at a retention time of ∼21 min. (c–e) Representative LC/MS detection traces of (c) the internal control Glu-N15 and the Glu level (d) at the baseline and (e) after impact. (f) Quantification of Glu levels before and at 1 and 10 min after injury. Student t test. *P < 0.05; **P < 0.01 vs. before.

Comment in

  • Toward in vitro models of brain structure and function.
    Shuler ML, Hickman JJ. Shuler ML, et al. Proc Natl Acad Sci U S A. 2014 Sep 23;111(38):13682-3. doi: 10.1073/pnas.1414484111. Epub 2014 Sep 5. Proc Natl Acad Sci U S A. 2014. PMID: 25192937 Free PMC article. No abstract available.

References

    1. Hill SL, Wang Y, Riachi I, Schürmann F, Markram H. Statistical connectivity provides a sufficient foundation for specific functional connectivity in neocortical neural microcircuits. Proc Natl Acad Sci USA. 2012;109(42):E2885–E2894. - PMC - PubMed
    1. Biswal BB, et al. Toward discovery science of human brain function. Proc Natl Acad Sci USA. 2010;107(10):4734–4739. - PMC - PubMed
    1. Sperry RW. Chemoaffinity in the orderly growth of nerve fiber patterns and connections. Proc Natl Acad Sci USA. 1963;50:703–710. - PMC - PubMed
    1. Imai T, et al. Pre-target axon sorting establishes the neural map topography. Science. 2009;325(5940):585–590. - PubMed
    1. Griffith LG, Swartz MA. Capturing complex 3D tissue physiology in vitro. Nat Rev Mol Cell Biol. 2006;7(3):211–224. - PubMed

Publication types