. 2014 Aug 26;111(34):12331-6.
doi: 10.1073/pnas.1412797111. Epub 2014 Aug 11.

Quasi-resonant circulation regimes and hemispheric synchronization of extreme weather in boreal summer

Affiliations

Quasi-resonant circulation regimes and hemispheric synchronization of extreme weather in boreal summer

Dim Coumou et al. Proc Natl Acad Sci U S A. .

Abstract

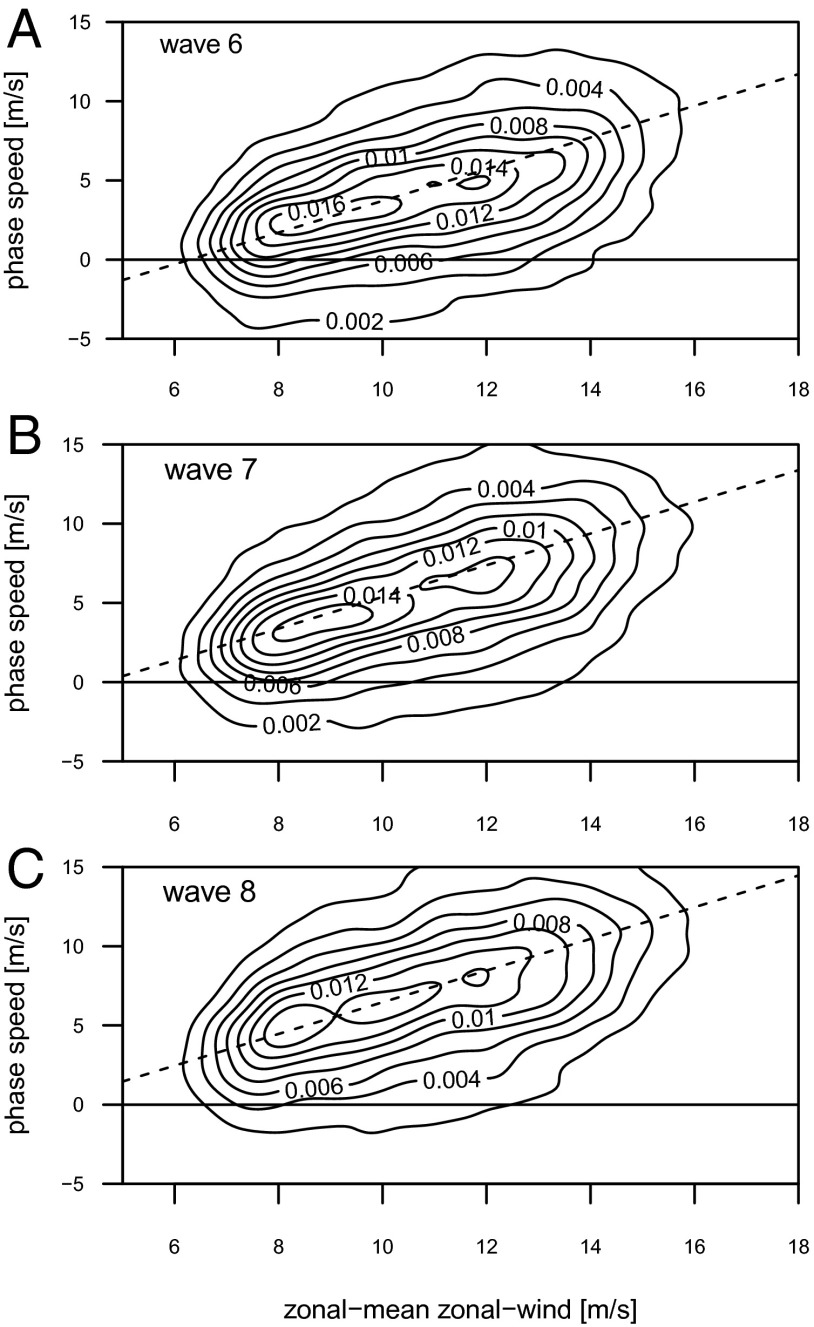
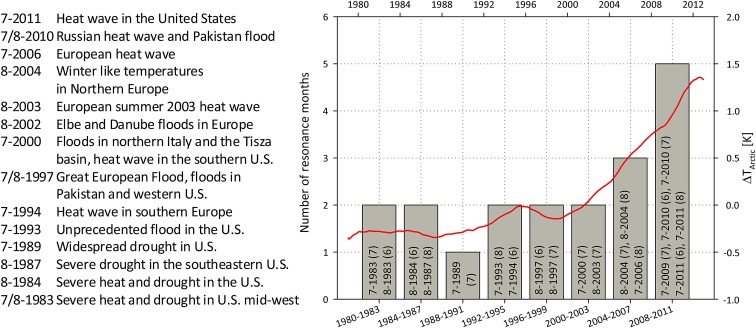
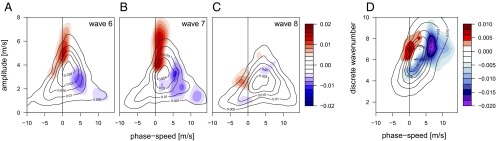
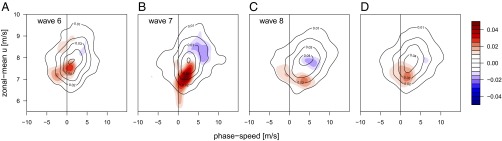
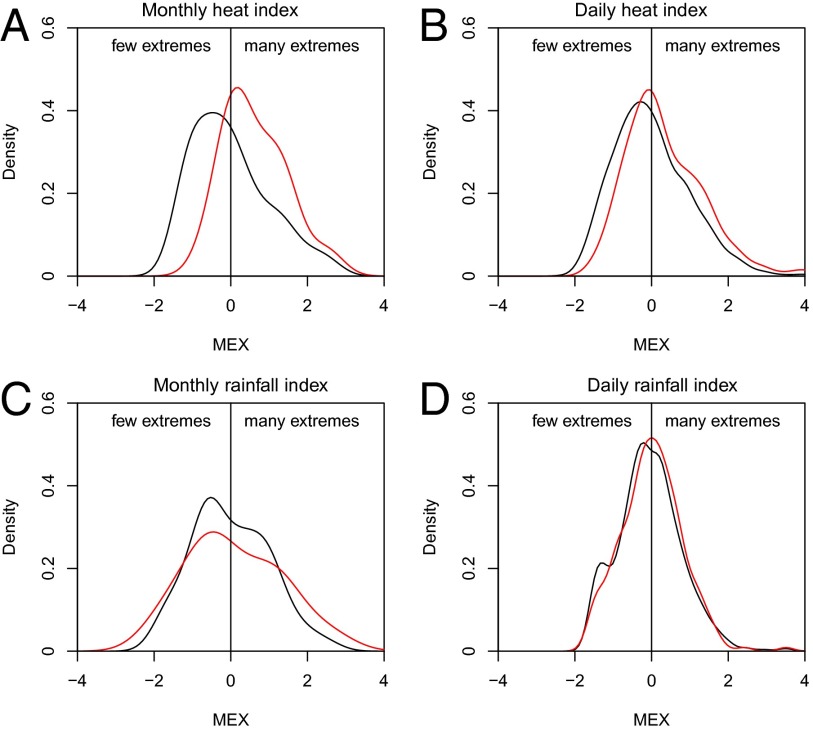
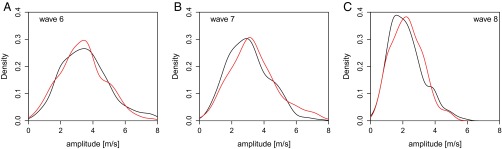
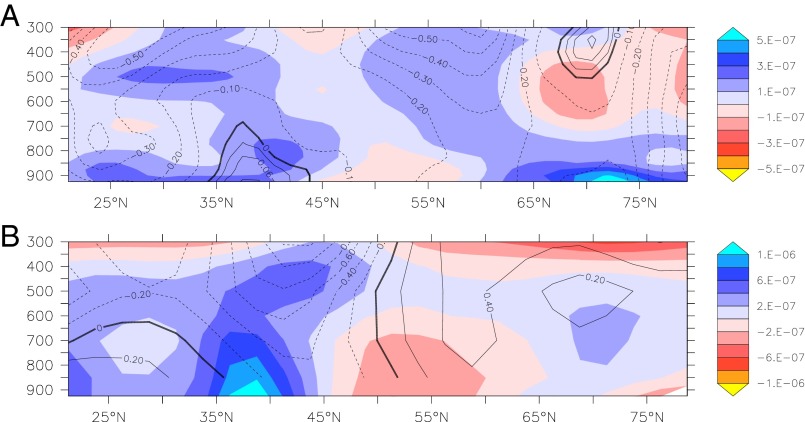
The recent decade has seen an exceptional number of high-impact summer extremes in the Northern Hemisphere midlatitudes. Many of these events were associated with anomalous jet stream circulation patterns characterized by persistent high-amplitude quasi-stationary Rossby waves. Two mechanisms have recently been proposed that could provoke such patterns: (i) a weakening of the zonal mean jets and (ii) an amplification of quasi-stationary waves by resonance between free and forced waves in midlatitude waveguides. Based upon spectral analysis of the midtroposphere wind field, we show that the persistent jet stream patterns were, in the first place, due to an amplification of quasi-stationary waves with zonal wave numbers 6-8. However, we also detect a weakening of the zonal mean jet during these events; thus both mechanisms appear to be important. Furthermore, we demonstrate that the anomalous circulation regimes lead to persistent surface weather conditions and therefore to midlatitude synchronization of extreme heat and rainfall events on monthly timescales. The recent cluster of resonance events has resulted in a statistically significant increase in the frequency of high-amplitude quasi-stationary waves of wave numbers 7 and 8 in July and August. We show that this is a robust finding that holds for different pressure levels and reanalysis products. We argue that recent rapid warming in the Arctic and associated changes in the zonal mean zonal wind have created favorable conditions for double jet formation in the extratropics, which promotes the development of resonant flow regimes.

Keywords: Arctic amplification; climate change; climate impact; midlatitude weather; planetary waves.


Conflict of interest statement

The authors declare no conflict of interest.

Figures

Fig. 1.
Fig. 1.
The 2D probability density distributions for daily values of the zonal mean zonal wind (U) and wave phase speed (c) at 500 mb aggregated from 35°N to 65°N for the 1979–2012 period for (A) wave 6, (B) wave 7, and (C) wave 8 for all calendar days. The dashed line shows the linear relationship given by Eq. 1.
Fig. 2.
Fig. 2.
Number of July and August resonance months identified by Petoukhov et al. (16) for eight 4-y periods from 1980 to 2011. Text in the gray bars indicates the actual months with, in brackets, the wave number involved in resonance, and the table on the left lists the associated extreme weather events (adapted from ref. 16). The red line plots the difference of surface warming in the Arctic (north of 65°N) and in the rest of the Northern Hemisphere (south of 65°N), illustrating the much more rapid surface warming in the Arctic since 2000.
Fig. 3.
Fig. 3.
The 2D probability density distributions for daily values of the wave phase speed c and wave amplitude at 500 mb aggregated from 35°N to 65°N for days in July−August for the 1979–2012 period (solid lines) for (A) wave 6, (B) wave 7, and (C) wave 8. (D) The 2D power density plot (see SI Appendix, Methods) of wave number against phase speed. Color contours in all panels plot the anomaly during resonance months, showing an increase (red) in quasi-stationary waves and a decrease (blue) in transient waves.
Fig. 4.
Fig. 4.
The 2D probability density distributions for daily values of the wave phase speed c and the zonal mean zonal wind (U) at 500 mb aggregated from 35°N to 65°N for days in July−August during 1979–2012 (solid lines) for (A) wave 6, (B) wave 7, (C) wave 8, and (D) the mean distribution for these three waves. Color contours plot the anomaly during resonance months, showing an increase in quasi-stationary flow patterns with reduced zonal mean winds.
Fig. 5.
Fig. 5.
Midlatitudinal extreme index (MEX) in units of SD for (A) monthly heat extremes, (B) daily heat extremes, (C) monthly rainfall extremes, and (D) daily rainfall extremes for 1979–2012 July−August climatology (black) and resonance months (red).
Fig. 6.
Fig. 6.
Probability density distributions of quasi-stationary waves (|c| < 2 m/s) at 500 mb for days in July−August during 1979–1999 (black) and 2000–2012 (red) for (A) wave 6, (B) wave 7, and (C) wave 8 in the Era Interim reanalysis. The shift in the distribution of wave 7 to higher amplitudes is statistically significant (see SI Appendix, Table S1).
Fig. 7.
Fig. 7.
(A) Anomaly in poleward thermal gradient (color contours) in degrees Centrigrade per meter and zonal mean zonal wind (contour lines) in meters per second for July−August in 2000–2012 compared with 1979–1999. Negative anomalies (red) strengthen the magnitude and positive anomalies (blue) weaken the magnitude of the thermal gradient. Solid contours indicate an amplification of the zonal mean zonal wind and dashed contours indicate a weakening. (B) Same as in A but showing anomalies for 2081–2100 compared with 1981–2000 of the multimodel mean of the CMIP5 set of climate projections under scenario RCP8.5.

References

    1. Westra S, Alexander LV, Zwiers FW. Global increasing trends in annual maximum daily precipitation. J Clim. 2013;26(11):3904–3918.
    1. Zhang X, Wan H, Zwiers FW, Hegerl GC, Min S-K. Attributing intensification of precipitation extremes to human influence. Geophys Res Lett. 2013;40(19):5252–5257.
    1. Sillmann J, Kharin VV, Zhang X, Zwiers FW, Bronaugh D. Climate extremes indices in the CMIP5 multi-model ensemble. Part 1 : Model evaluation in the present. J Geophys Res. 2013;118(4):1716–1733.
    1. Coumou D, Robinson A, Rahmstorf S. Global increase in record-breaking monthly-mean temperatures. Clim Change. 2013;118(3-4):771–782.
    1. Coumou D, Robinson A. Historic and future increase in the global land area affected by monthly heat extremes. Environ Res Lett. 2013;8(3):034018.

LinkOut - more resources