. 2014 Aug 26;111(34):E3501-5.
doi: 10.1073/pnas.1407229111. Epub 2014 Aug 11.

The Holocene temperature conundrum

Affiliations

The Holocene temperature conundrum

Zhengyu Liu et al. Proc Natl Acad Sci U S A. .

Abstract

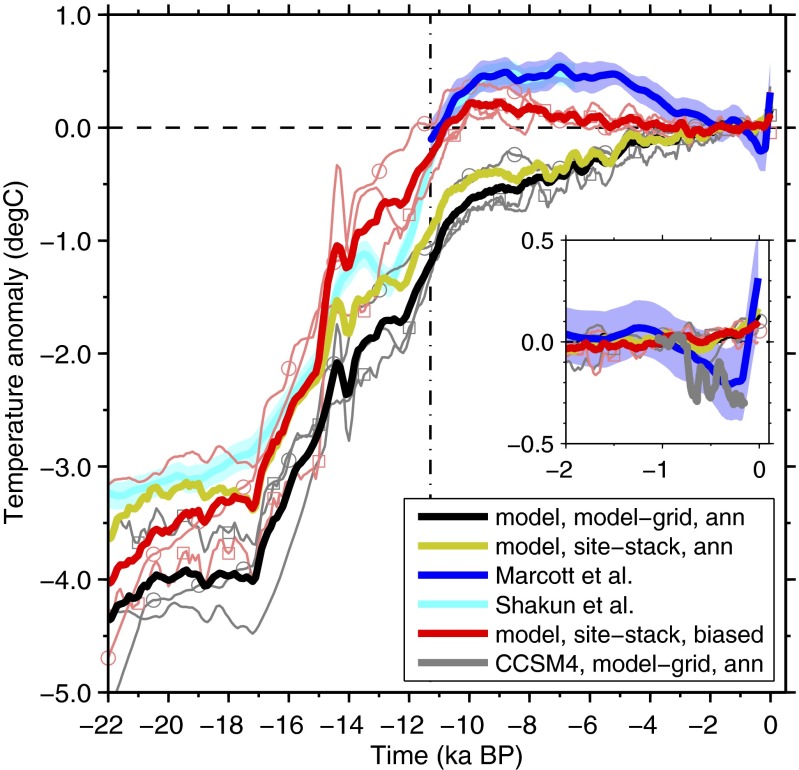
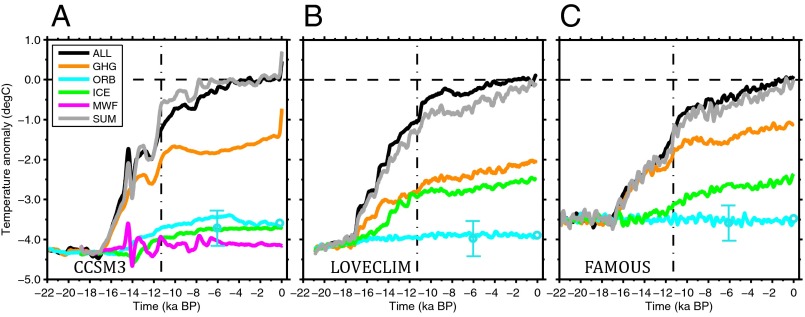
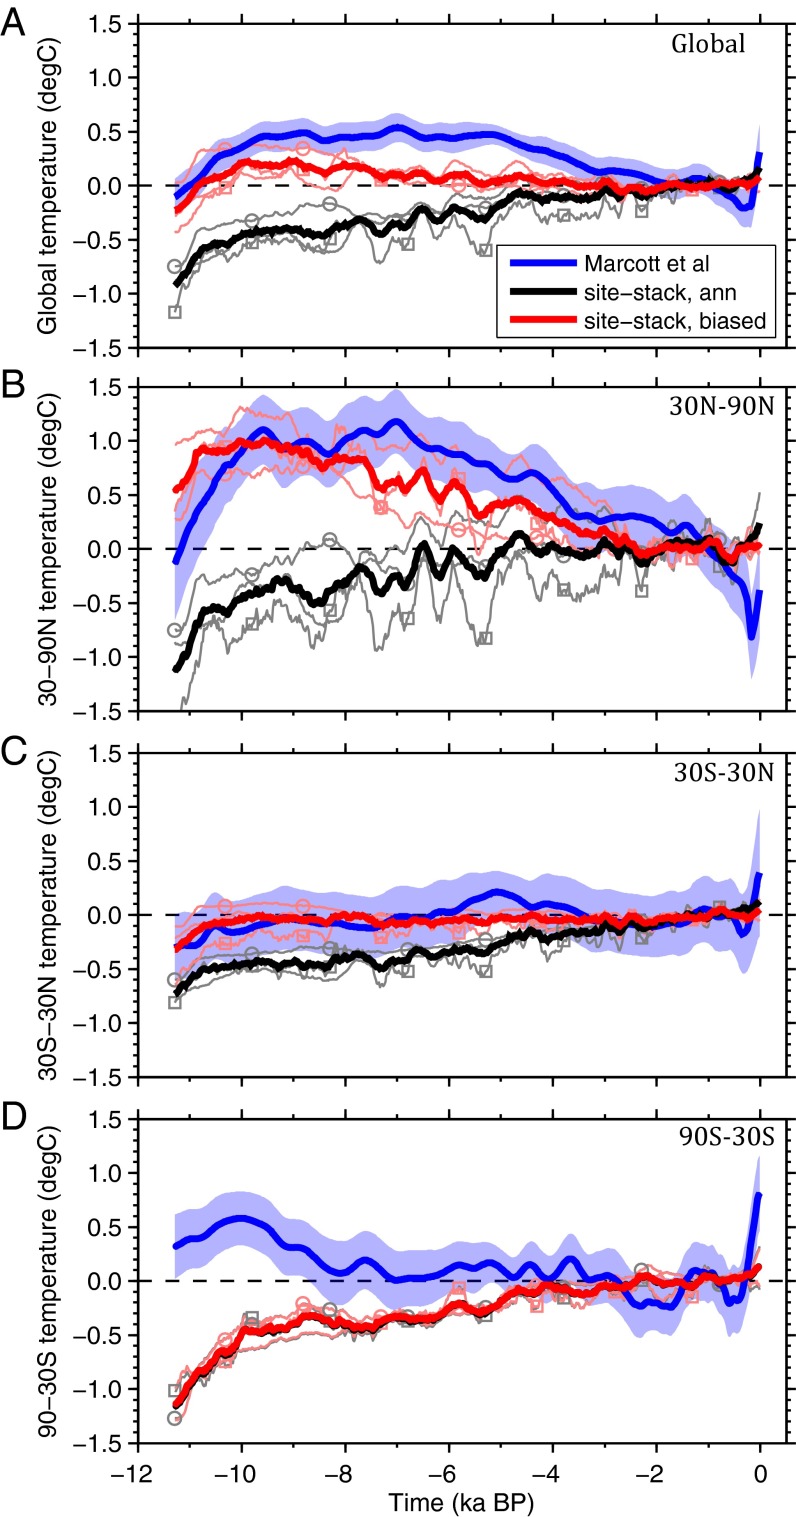
A recent temperature reconstruction of global annual temperature shows Early Holocene warmth followed by a cooling trend through the Middle to Late Holocene [Marcott SA, et al., 2013, Science 339(6124):1198-1201]. This global cooling is puzzling because it is opposite from the expected and simulated global warming trend due to the retreating ice sheets and rising atmospheric greenhouse gases. Our critical reexamination of this contradiction between the reconstructed cooling and the simulated warming points to potentially significant biases in both the seasonality of the proxy reconstruction and the climate sensitivity of current climate models.

Keywords: Holocene temperature; global temperature; model-data inconsistency.


Conflict of interest statement

The authors declare no conflict of interest.

Figures

Fig. 1.
Fig. 1.
Evolution of the global surface temperature of the last 22 ka: the reconstructions of M13 (1) (blue) after 11.3 ka and by Shakun et al. (11) (cyan) before 6.5 ka, the model annual mean temperature averaged over the global grid points (black), and the model seasonally biased temperature averaged over the proxy sites (red). The models are the CCSM3 (7), FAMOUS (8), and LOVECLIM (9), with the ensemble mean shown by heavy solid lines and individual members shown by light thin lines [the LOVECLIM (○) and FAMOUS (□) are marked]. Each temperature curve is aligned at 1 ka. The ensemble mean model annual temperature averaged over proxy sites is also shown (yellow, individual models for the Holocene in Fig. 3), whose similarity to the model grid average demonstrates the insensitivity of the temperature trend to the average scheme. (Inset) Expanded part after 2 ka, with the addition of the last millennium experiment in the CCSM4 (gray), which is forced additionally by volcanic aerosol and solar variability (10). ann, annual.
Fig. 2.
Fig. 2.
Global annual mean temperature averaged over model grids under the full forcing (ALL, black) and the individual forcings [GHG, orange; orbital, cyan; ICE, green; and meltwater flux, magenta (only in CCSM3)], as well as the sum of the four single forcing simulations (SUM, gray). The PMIP temperatures are shown in ensemble means at 0 and 6 ka (cyan circles) (with 0 ka being ∼0.1 °C warmer than 6 ka) and ensemble spread (vertical bar as 1 SD). The CCSM3 (A), LOVECLIM (B), and FAMOUS (C) are shown.
Fig. 3.
Fig. 3.
Simulated global and regional mean temperatures for the last 11 ka for the three-member ensemble transient simulations and the standard 5° × 5° weighted temperature stack from the proxy dataset from M13 (blue). The models are plotted in ensemble mean (heavy solid line) and individual models (thin light lines), with the LOVECLIM (○) and FAMOUS (□) marked, for the site-stacked annual mean (black) and site-stacked seasonally biased (red). The global mean (A), Northern Hemisphere (30–90° N) mean (B), tropical (30° S–30° N) mean (C), and Southern Hemisphere (90–30° S) mean (D) are shown. The global cooling trend in the biased model global temperature stack is contributed mostly by the Northern Hemisphere bias.

References

    1. Marcott SA, Shakun JD, Clark PU, Mix AC. A reconstruction of regional and global temperature for the past 11,300 years. Science. 2013;339(6124):1198–1201. - PubMed
    1. Wanner H, et al. Mid- to late Holocene climate change: An overview. Quat Sci Rev. 2008;27:1791–1828.
    1. COHMAP MEMBERS Climatic changes of the last 18,000 years: Observations and model simulations. Science. 1988;241(4869):1043–1052. - PubMed
    1. Braconnot P, et al. Evaluation of climate models using palaeoclimatic data. Nat Clim Change. 2012;2:417–424.
    1. Renssen H, et al. The spatial and temporal complexity of the Holocene Thermal Maximum. Nat Geosci. 2009;2:411–414.

Publication types

LinkOut - more resources