Impaired resolution of inflammation in the Endoglin heterozygous mouse model of chronic colitis
- PMID: 25114380
- PMCID: PMC4121192
- DOI: 10.1155/2014/767185
Impaired resolution of inflammation in the Endoglin heterozygous mouse model of chronic colitis
Abstract
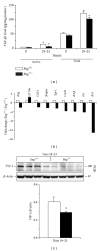
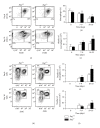
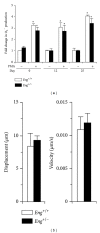
Endoglin is a coreceptor of the TGF-β superfamily predominantly expressed on the vascular endothelium and selective subsets of immune cells. We previously demonstrated that Endoglin heterozygous (Eng (+/-)) mice subjected to dextran sulfate sodium (DSS) developed persistent gut inflammation and pathological angiogenesis. We now report that colitic Eng (+/-) mice have low colonic levels of active TGF-β1, which was associated with reduced expression of thrombospondin-1, an angiostatic factor known to activate TGF-β1. We also demonstrate dysregulated expression of BMPER and follistatin, which are extracellular regulators of the TGF-β superfamily that modulate angiogenesis and inflammation. Heightened colonic levels of the neutrophil chemoattractant and proangiogenic factor, CXCL1, were also observed in DSS-treated Eng (+/-) mice. Interestingly, despite increased macrophage and neutrophil infiltration, a gut-specific reduction in expression of the key phagocytic respiratory burst enzymes, NADPH oxidase 2 (Nox-2) and myeloperoxidase, was seen in Eng (+/-) mice undergoing persistent inflammation. Taken together, these findings suggest that endoglin is required for TGF-β superfamily mediated resolution of inflammation and fully functional myeloid cells.
Figures


Similar articles
-
Anti-VEGF therapy reduces intestinal inflammation in Endoglin heterozygous mice subjected to experimental colitis.Angiogenesis. 2014 Jul;17(3):641-59. doi: 10.1007/s10456-014-9421-x. Epub 2014 Feb 9. Angiogenesis. 2014. PMID: 24510304
-
Dextran sulfate sodium leads to chronic colitis and pathological angiogenesis in Endoglin heterozygous mice.Inflamm Bowel Dis. 2010 Nov;16(11):1859-70. doi: 10.1002/ibd.21288. Inflamm Bowel Dis. 2010. PMID: 20848471 Free PMC article.
-
Endoglin regulates renal ischaemia-reperfusion injury.Nephrol Dial Transplant. 2006 Aug;21(8):2106-19. doi: 10.1093/ndt/gfl179. Epub 2006 Jun 4. Nephrol Dial Transplant. 2006. PMID: 16751653
-
Reducing endoglin activity limits calcineurin and TRPC-6 expression and improves survival in a mouse model of right ventricular pressure overload.J Am Heart Assoc. 2014 Jul 11;3(4):e000965. doi: 10.1161/JAHA.114.000965. J Am Heart Assoc. 2014. PMID: 25015075 Free PMC article.
-
Hereditary hemorrhagic telangiectasia, a vascular dysplasia affecting the TGF-beta signaling pathway.Clin Med Res. 2006 Mar;4(1):66-78. doi: 10.3121/cmr.4.1.66. Clin Med Res. 2006. PMID: 16595794 Free PMC article. Review.
Cited by
-
BMP Receptor Inhibition Enhances Tissue Repair in Endoglin Heterozygous Mice.Int J Mol Sci. 2021 Feb 18;22(4):2010. doi: 10.3390/ijms22042010. Int J Mol Sci. 2021. PMID: 33670533 Free PMC article.
-
Hereditary Hemorrhagic Telangiectasia: Genetics, Pathophysiology, Diagnosis, and Management.J Clin Med. 2022 Sep 5;11(17):5245. doi: 10.3390/jcm11175245. J Clin Med. 2022. PMID: 36079173 Free PMC article. Review.
-
Endoglin as an Adhesion Molecule in Mature and Progenitor Endothelial Cells: A Function Beyond TGF-β.Front Med (Lausanne). 2019 Jan 30;6:10. doi: 10.3389/fmed.2019.00010. eCollection 2019. Front Med (Lausanne). 2019. PMID: 30761306 Free PMC article. Review.
-
Mononuclear cells and vascular repair in HHT.Front Genet. 2015 Mar 23;6:114. doi: 10.3389/fgene.2015.00114. eCollection 2015. Front Genet. 2015. PMID: 25852751 Free PMC article. Review.
-
An update on preclinical models of hereditary haemorrhagic telangiectasia: Insights into disease mechanisms.Front Med (Lausanne). 2022 Sep 29;9:973964. doi: 10.3389/fmed.2022.973964. eCollection 2022. Front Med (Lausanne). 2022. PMID: 36250069 Free PMC article. Review.
References
-
- Maloy KJ, Powrie F. Intestinal homeostasis and its breakdown in inflammatory bowel disease. Nature. 2011;474(7351):298–306. - PubMed
-
- Nathan C, Ding A. Nonresolving inflammation. Cell. 2010;140(6):871–882. - PubMed
-
- Chidlow JH, Jr., Shukla D, Grisham MB, Kevil CG. Pathogenic angiogenesis in IBD and experimental colitis: new ideas and therapeutic avenues. American Journal of Physiology—Gastrointestinal and Liver Physiology. 2007;293(1):G5–G18. - PubMed
Publication types
MeSH terms
Substances
Grants and funding
LinkOut - more resources
Full Text Sources
Other Literature Sources
Molecular Biology Databases
Research Materials
Miscellaneous

