

Relative sensitivity and specificity of 10-2 visual fields, multifocal electroretinography, and spectral domain optical coherence tomography in detecting hydroxychloroquine and chloroquine retinopathy
- PMID: 25114499
- PMCID: PMC4122553
- DOI: 10.2147/OPTH.S66527
Relative sensitivity and specificity of 10-2 visual fields, multifocal electroretinography, and spectral domain optical coherence tomography in detecting hydroxychloroquine and chloroquine retinopathy
Abstract
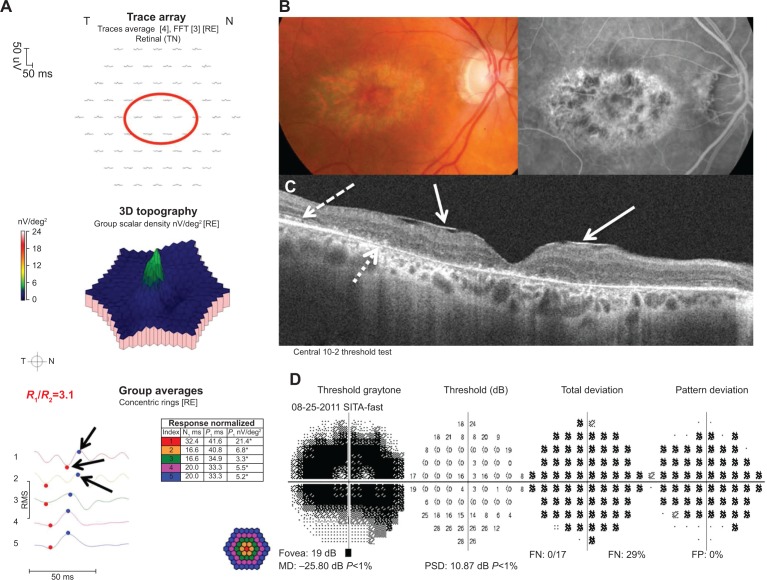
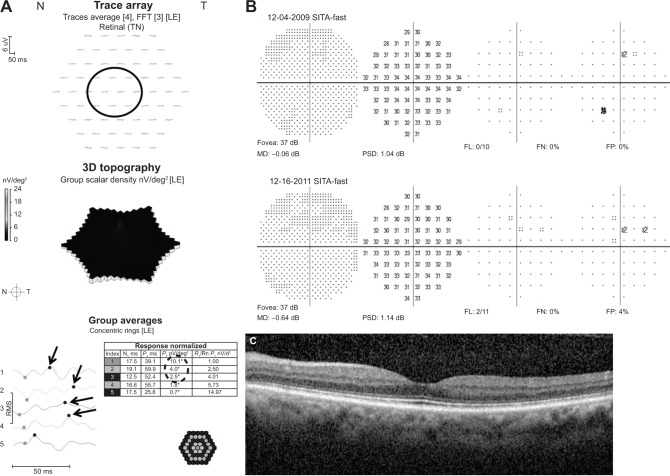
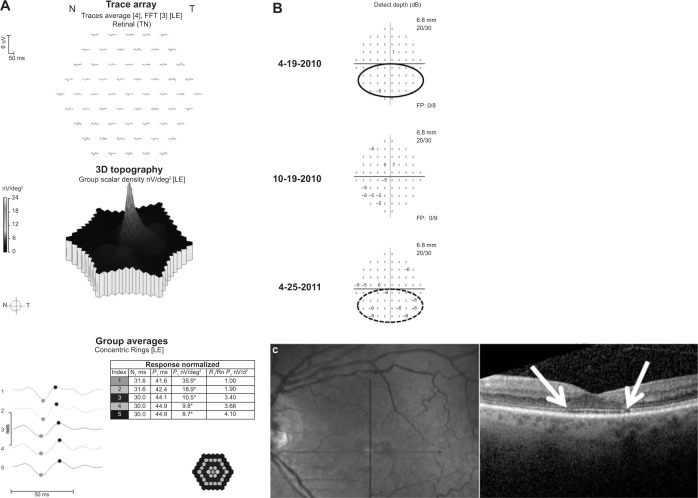
Background: The purpose of this study was to determine the relative sensitivity and specificity of 10-2 visual fields (10-2 VFs), multifocal electroretinography (mfERG), and spectral domain optical coherence tomography (SD-OCT) in detecting hydroxychloroquine retinopathy.
Methods: A total of 121 patients taking hydroxychloroquine (n=119) or chloroquine (n=2) with 10-2 VF, mfERG, and SD-OCT tests were retrospectively reviewed. Rates of test abnormality were determined.
Results: Retinopathy was present in 14 and absent in 107. Eleven of 14 (78.6%) patients with retinopathy were overdosed. Twelve (85.7%) had cumulative dosing greater than 1,000 g. The sensitivities of 10-2 VF, mfERG, and SD-OCT in detecting retinopathy were 85.7%, 92.9%, and 78.6%, respectively. The specificities of 10-2 VF, mfERG, and SD-OCT in detecting retinopathy were 92.5%, 86.9%, and 98.1%, respectively. Positive predictive values of 10-2 VF, mfERG, and SD-OCT in detecting retinopathy were less than 30% for all estimates of hydroxychloroquine retinopathy prevalence. Negative predictive values were >99% for all tests.
Conclusion: Based on published estimates of hydroxychloroquine retinopathy prevalence, all three tests are most reliable when negative, allowing confident exclusion of retinopathy in patients taking ≤6.5 mg/kg/day. Each test is less useful in allowing a confident diagnosis of retinopathy when positive, especially in patients taking ≤6.5 mg/kg/day.
Keywords: chloroquine; hydroxychloroquine; ideal body weight; multifocal electroretinography; retinopathy; spectral domain optical coherence tomography; toxicity.
Figures
Similar articles
-
The Diagnostic Utility of Multifocal Electroretinography in Detecting Chloroquine and Hydroxychloroquine Retinal Toxicity.Am J Ophthalmol. 2019 Oct;206:132-139. doi: 10.1016/j.ajo.2019.04.025. Epub 2019 May 10. Am J Ophthalmol. 2019. PMID: 31078540
-
Disparity between visual fields and optical coherence tomography in hydroxychloroquine retinopathy.Ophthalmology. 2014 Jun;121(6):1257-62. doi: 10.1016/j.ophtha.2013.12.002. Epub 2014 Jan 16. Ophthalmology. 2014. PMID: 24439759
-
A novel 5-ring multifocal electroretinography stimulus for detecting hydroxychloroquine retinal toxicity.Doc Ophthalmol. 2022 Apr;144(2):117-124. doi: 10.1007/s10633-021-09858-4. Epub 2021 Nov 11. Doc Ophthalmol. 2022. PMID: 34762206 Free PMC article.
-
Novel imaging techniques for hydroxychloroquine retinopathy.Front Med (Lausanne). 2022 Oct 13;9:1026934. doi: 10.3389/fmed.2022.1026934. eCollection 2022. Front Med (Lausanne). 2022. PMID: 36314000 Free PMC article. Review.
-
Hydroxychloroquine-induced Retinal Toxicity.Front Pharmacol. 2023 May 30;14:1196783. doi: 10.3389/fphar.2023.1196783. eCollection 2023. Front Pharmacol. 2023. PMID: 37324471 Free PMC article. Review.
Cited by
-
Risk of hydroxychloroquine retinopathy in the community.Rheumatology (Oxford). 2022 Aug 3;61(8):3172-3179. doi: 10.1093/rheumatology/keab844. Rheumatology (Oxford). 2022. PMID: 34788400 Free PMC article.
-
Comparison between multifocal ERG and C-Scan SD-OCT ("en face" OCT) in patients with a suspicion of antimalarial retinal toxicity: preliminary results.Doc Ophthalmol. 2018 Apr;136(2):97-111. doi: 10.1007/s10633-018-9625-2. Epub 2018 Mar 13. Doc Ophthalmol. 2018. PMID: 29536324
-
Frequency and Clinical Characteristics of Hydroxychloroquine Retinopathy in Korean Patients with Rheumatologic Diseases.J Korean Med Sci. 2017 Mar;32(3):522-527. doi: 10.3346/jkms.2017.32.3.522. J Korean Med Sci. 2017. PMID: 28145658 Free PMC article.
-
Early onset monocular hydroxychloroquine maculopathy in a systemic lupus erythematosus patient with history of central retinal artery occlusion: a case report.BMC Ophthalmol. 2022 Nov 14;22(1):434. doi: 10.1186/s12886-022-02657-8. BMC Ophthalmol. 2022. PMID: 36376841 Free PMC article.
-
Visual field examinations using different strategies in Asian patients taking hydroxychloroquine.Sci Rep. 2022 Aug 30;12(1):14778. doi: 10.1038/s41598-022-19048-0. Sci Rep. 2022. PMID: 36042337 Free PMC article.
References
-
- Bourke B, Jones S, Rajammal AK, Silman A, Smith R. Hydroxychloroquine and ocular toxicity recommendations on screening. 2009. [Accessed June 13, 2014]. Available from: http://www.rcophth.ac.uk/documents.asp?section=39§ionTitle=Publicati....
-
- Easterbrook M. An ophthalmological view on the efficacy and safety of chloroquine versus hydroxychloroquine. J Rheumatol. 1999;26:1866–1867. - PubMed
-
- Morsman CD, Livesey SJ, Richards IM, Jessop JD, Mills PV. Screening for hydroxychloroquine retinal toxicity: is it necessary? Eye. 1990;4:572–576. - PubMed
-
- Silman A, Shipley M. Ophthalmological monitoring for hydroxychloroquine toxicity: a scientific review of available data. Br J Rheumatol. 1997;36:599–601. - PubMed
-
- Browning DJ. Impact of the revised American Academy of Ophthalmology Guidelines regarding hydroxychloroquine screening on actual practice. Am J Ophthalmol. 2013;155:418–428. - PubMed
LinkOut - more resources
Full Text Sources
Other Literature Sources
