

Sudachitin, a polymethoxylated flavone, improves glucose and lipid metabolism by increasing mitochondrial biogenesis in skeletal muscle
- PMID: 25114710
- PMCID: PMC4128574
- DOI: 10.1186/1743-7075-11-32
Sudachitin, a polymethoxylated flavone, improves glucose and lipid metabolism by increasing mitochondrial biogenesis in skeletal muscle
Abstract
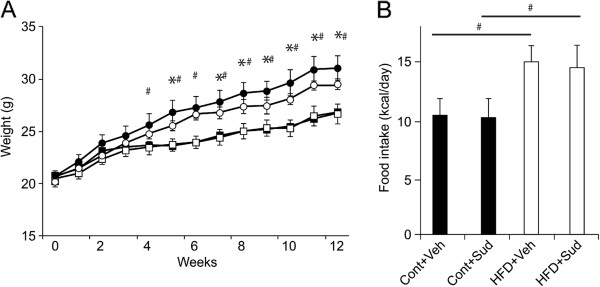
Background: Obesity is a major risk factor for insulin resistance, type 2 diabetes, and stroke. Flavonoids are effective antioxidants that protect against these chronic diseases. In this study, we evaluated the effects of sudachitin, a polymethoxylated flavonoid found in the skin of the Citrus sudachi fruit, on glucose, lipid, and energy metabolism in mice with high-fat diet-induced obesity and db/db diabetic mice. In our current study, we show that sudachitin improves metabolism and stimulates mitochondrial biogenesis, thereby increasing energy expenditure and reducing weight gain.
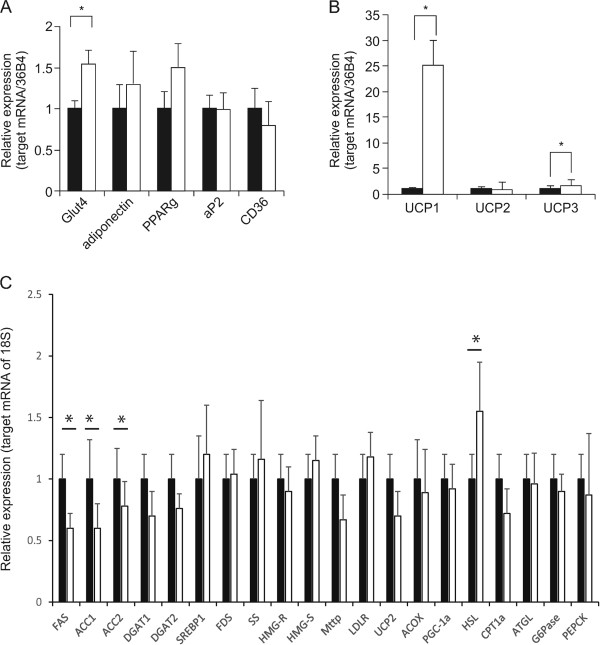
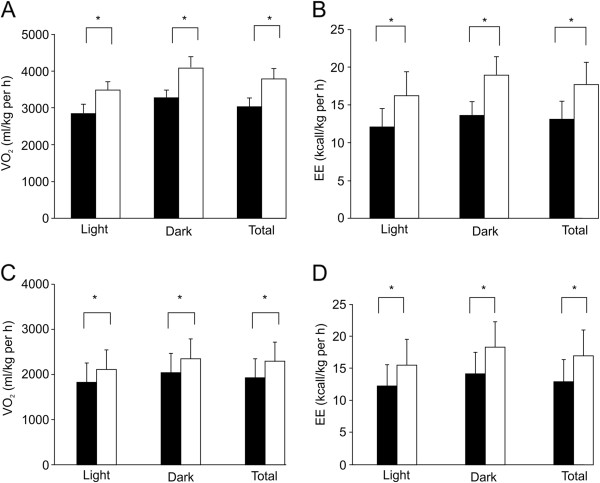
Methods: C57BL/6 J mice fed a high-fat diet (40% fat) and db/db mice fed a normal diet were treated orally with 5 mg/kg sudachitin or vehicle for 12 weeks. Following treatment, oxygen expenditure was assessed using indirect calorimetry, while glucose tolerance, insulin sensitivity, and indices of dyslipidemia were assessed by serum biochemistry. Quantitative polymerase chain reaction was used to determine the effect of sudachitin on the transcription of key metabolism-regulating genes in the skeletal muscle, liver, and white and brown adipose tissues. Primary myocytes were also prepared to examine the signaling mechanisms targeted by sudachitin in vitro.
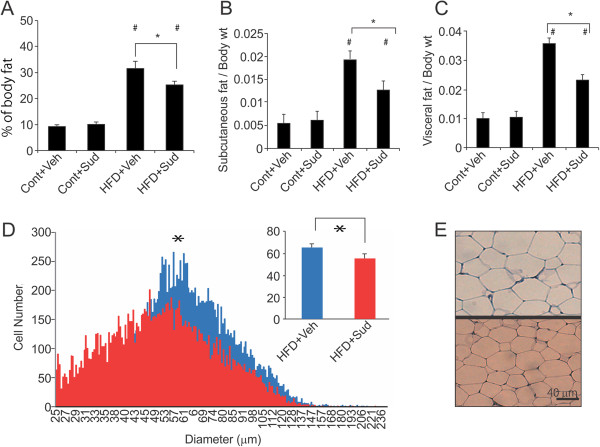
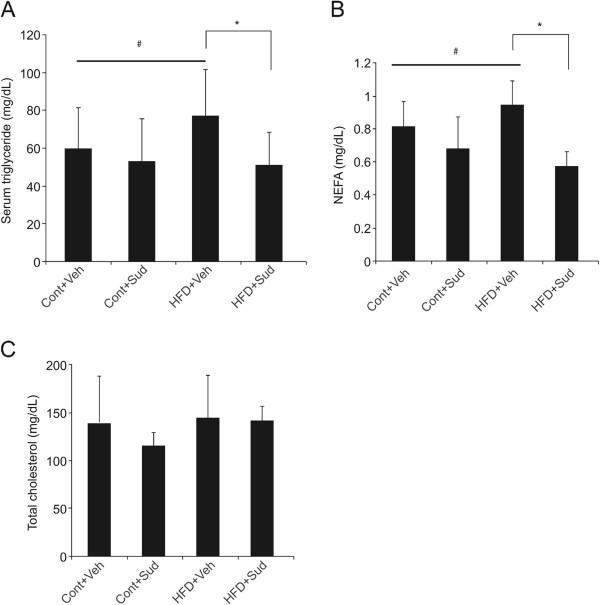
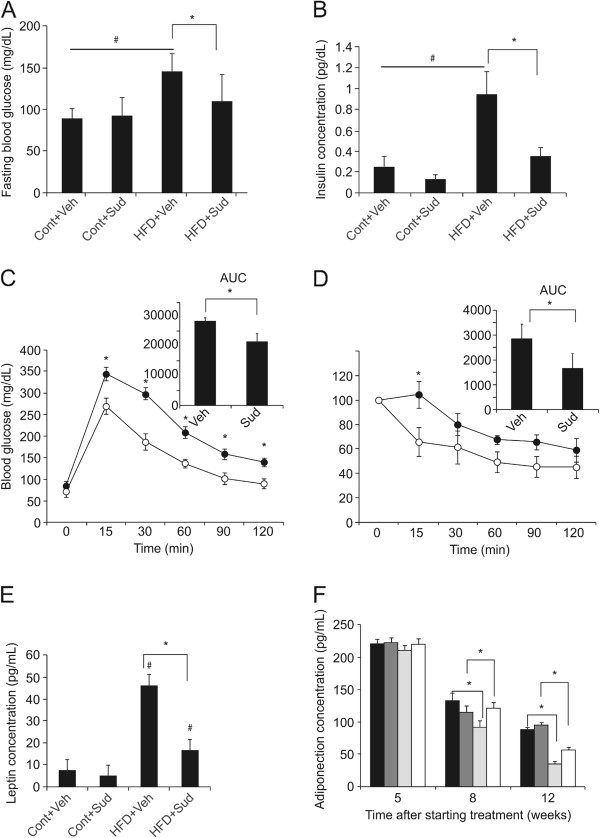
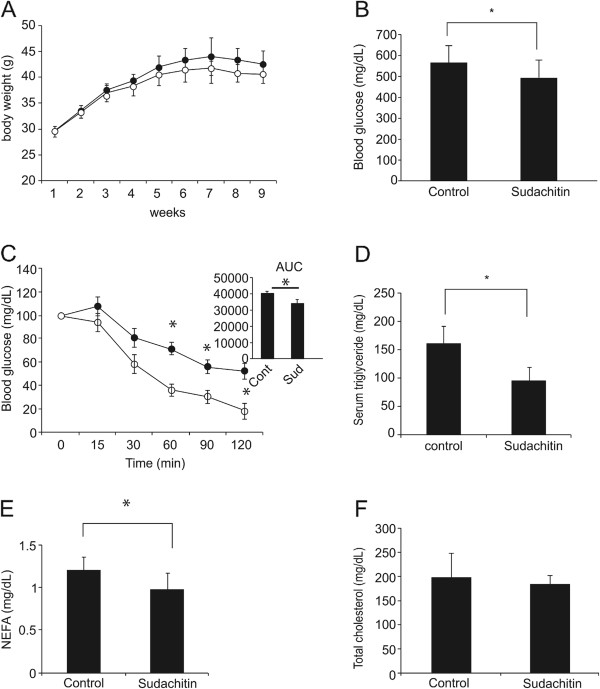
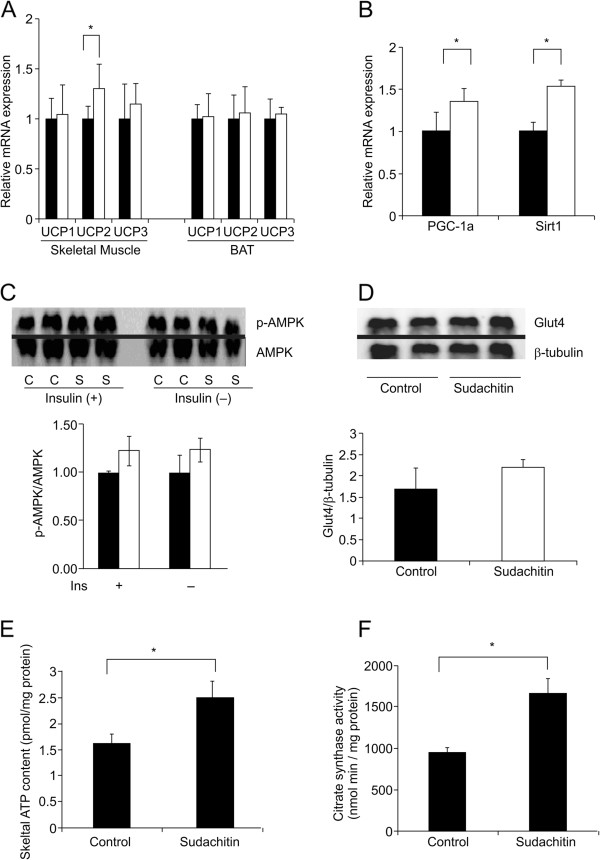
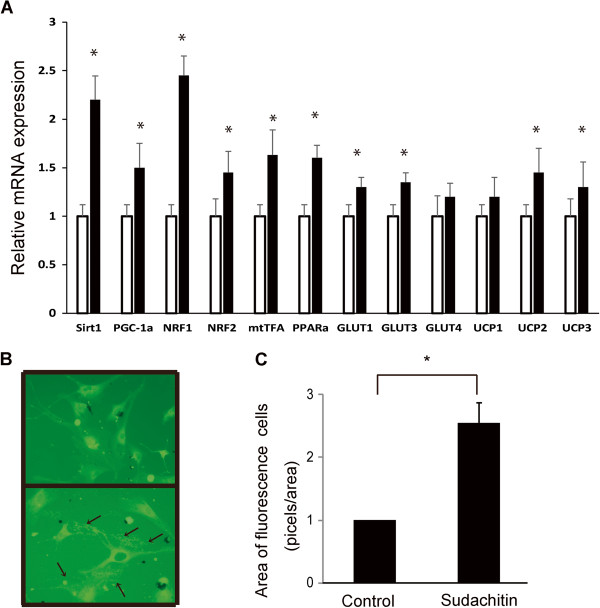
Results: Sudachitin improved dyslipidemia, as evidenced by reduction in triglyceride and free fatty acid levels, and improved glucose tolerance and insulin resistance. It also enhanced energy expenditure and fatty acid β-oxidation by increasing mitochondrial biogenesis and function. The in vitro assay results suggest that sudachitin increased Sirt1 and PGC-1α expression in the skeletal muscle.
Conclusions: Sudachitin may improve dyslipidemia and metabolic syndrome by improving energy metabolism. Furthermore, it also induces mitochondrial biogenesis to protect against metabolic disorders.
Keywords: Glucose metabolism; Lipid metabolism; Mitochondria; Sudachitin.
Figures
Similar articles
-
Sudachi peel extract powder including the polymethoxylated flavone sudachitin improves visceral fat content in individuals at risk for developing diabetes.Food Sci Nutr. 2021 Jun 15;9(8):4076-4084. doi: 10.1002/fsn3.2339. eCollection 2021 Aug. Food Sci Nutr. 2021. PMID: 34401059 Free PMC article.
-
Neuroprotective effect of, a flavonoid, sudachitin in mice stroke model.Brain Res. 2024 Mar 15;1827:148745. doi: 10.1016/j.brainres.2023.148745. Epub 2024 Jan 3. Brain Res. 2024. PMID: 38176520
-
Up-regulation of the Sirtuin 1 (Sirt1) and peroxisome proliferator-activated receptor γ coactivator-1α (PGC-1α) genes in white adipose tissue of Id1 protein-deficient mice: implications in the protection against diet and age-induced glucose intolerance.J Biol Chem. 2014 Oct 17;289(42):29112-22. doi: 10.1074/jbc.M114.571679. Epub 2014 Sep 4. J Biol Chem. 2014. PMID: 25190816 Free PMC article.
-
Astaxanthin stimulates mitochondrial biogenesis in insulin resistant muscle via activation of AMPK pathway.J Cachexia Sarcopenia Muscle. 2020 Feb;11(1):241-258. doi: 10.1002/jcsm.12530. Epub 2020 Jan 31. J Cachexia Sarcopenia Muscle. 2020. PMID: 32003547 Free PMC article.
-
Therapeutic overview of sudachitin.J Biochem Mol Toxicol. 2024 Nov;38(11):e70003. doi: 10.1002/jbt.70003. J Biochem Mol Toxicol. 2024. PMID: 39392135 Review.
Cited by
-
The flavonoid Sudachitin regulates glucose metabolism via PDE inhibition.Heliyon. 2024 Aug 8;10(16):e35978. doi: 10.1016/j.heliyon.2024.e35978. eCollection 2024 Aug 30. Heliyon. 2024. PMID: 39224336 Free PMC article.
-
Bifidobacterium animalis subsp. lactis A6 Alleviates Obesity Associated with Promoting Mitochondrial Biogenesis and Function of Adipose Tissue in Mice.Molecules. 2020 Mar 25;25(7):1490. doi: 10.3390/molecules25071490. Molecules. 2020. PMID: 32218367 Free PMC article.
-
Natural Bioactive Compounds as Potential Browning Agents in White Adipose Tissue.Pharm Res. 2021 Apr;38(4):549-567. doi: 10.1007/s11095-021-03027-7. Epub 2021 Mar 30. Pharm Res. 2021. PMID: 33783666 Free PMC article. Review.
-
Citrus Flavonoids as Promising Phytochemicals Targeting Diabetes and Related Complications: A Systematic Review of In Vitro and In Vivo Studies.Nutrients. 2020 Sep 23;12(10):2907. doi: 10.3390/nu12102907. Nutrients. 2020. PMID: 32977511 Free PMC article.
-
A Narrative Review of the Effects of Citrus Peels and Extracts on Human Brain Health and Metabolism.Nutrients. 2022 Apr 28;14(9):1847. doi: 10.3390/nu14091847. Nutrients. 2022. PMID: 35565814 Free PMC article. Review.
References
-
- Baur JA, Pearson KJ, Price NL, Jamieson HA, Lerin C, Kalra A, Prabhu VV, Allard JS, Lopez-Lluch G, Lewis K, Pistell PJ, Poosala S, Becker KG, Boss O, Gwinn D, Wang M, Ramaswamy S, Fishbein KW, Spencer RG, Lakatta EG, Le Couteur D, Shaw RJ, Navas P, Puigserver P, Ingram DK, de Cabo R, Sinclair DA. Resveratrol improves health and survival of mice on a high-calorie diet. Nature. 2006;444:337–342. doi: 10.1038/nature05354. - DOI - PMC - PubMed
-
- Mulvihill EE, Allister EM, Sutherland BG, Telford DE, Sawyez CG, Edwards JY, Markle JM, Hegele RA, Huff MW. Naringenin prevents dyslipidemia, apolipoprotein B overproduction, and hyperinsulinemia in LDL receptor-null mice with diet-induced insulin resistance. Diabetes. 2009;58:2198–2210. doi: 10.2337/db09-0634. - DOI - PMC - PubMed
LinkOut - more resources
Full Text Sources
Other Literature Sources
Miscellaneous
