

The effects of microsatellite selection on linked sequence diversity
- PMID: 25115009
- PMCID: PMC4122932
- DOI: 10.1093/gbe/evu134
The effects of microsatellite selection on linked sequence diversity
Abstract
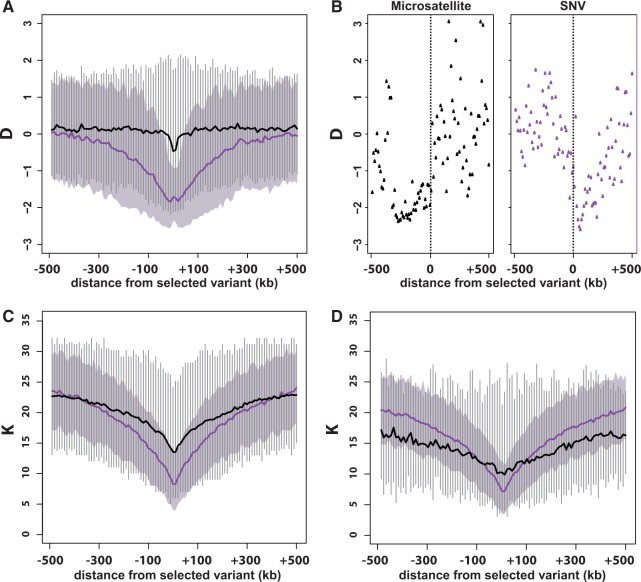
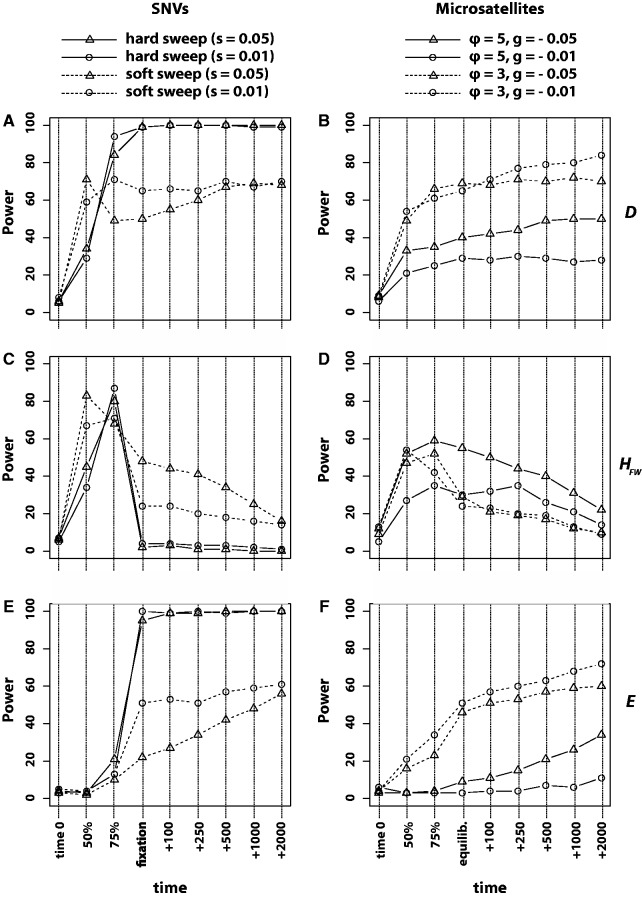
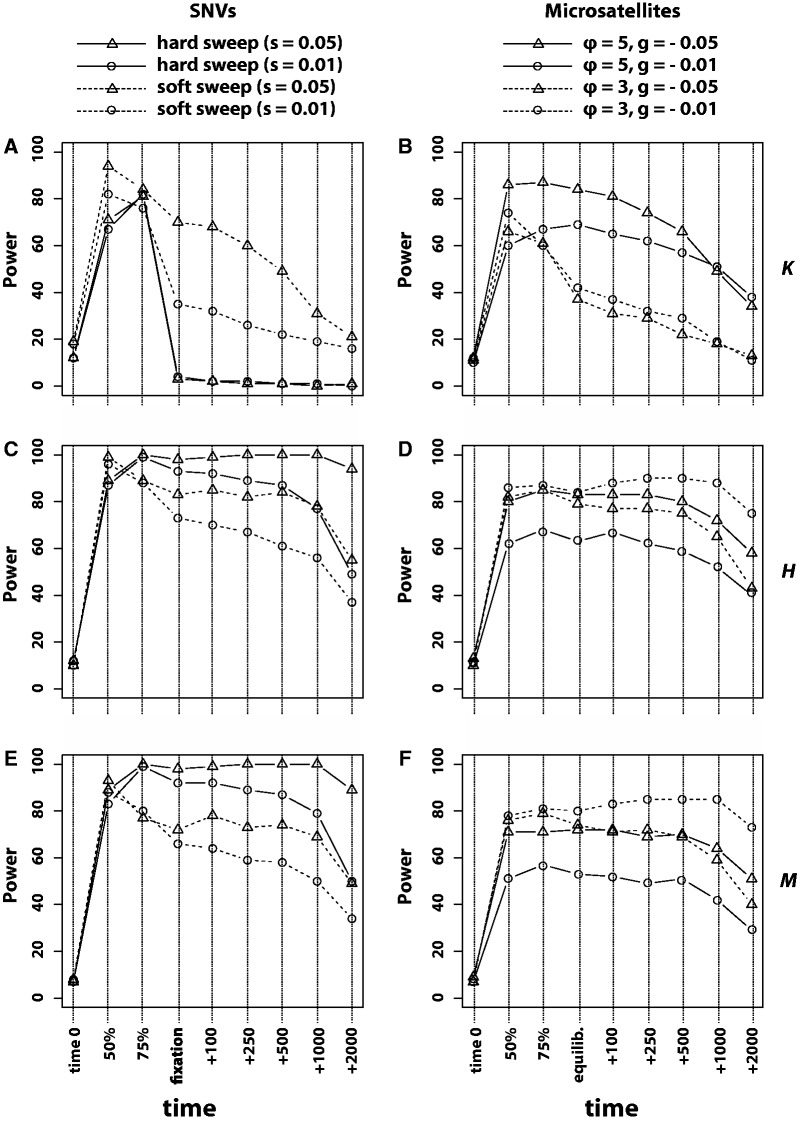
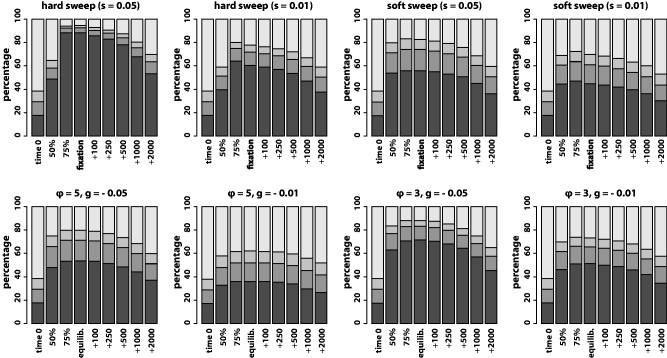
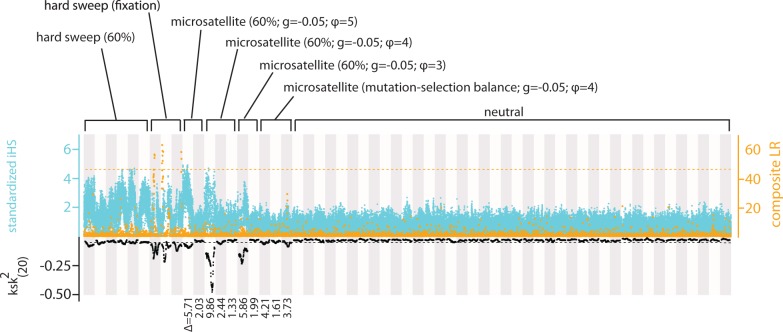
The genome-wide scan for selection is an important method for identifying loci involved in adaptive evolution. However, theory that underlies standard scans for selection assumes a simple mutation model. In particular, recurrent mutation of the selective target is not considered. Although this assumption is reasonable for single-nucleotide variants (SNVs), a microsatellite targeted by selection will reliably violate this assumption due to high mutation rate. Moreover, the mutation rate of microsatellites is generally high enough to ensure that recurrent mutation is pervasive rather than occasional. It is therefore unclear if positive selection targeting microsatellites can be detected using standard scanning statistics. Examples of functional variation at microsatellites underscore the significance of understanding the genomic effects of microsatellite selection. Here, we investigate the joint effects of selection and complex mutation on linked sequence diversity, comparing simulations of microsatellite selection and SNV-based selective sweeps. We find that selection on microsatellites is generally difficult to detect using popular summaries of the site frequency spectrum, and, under certain conditions, using popular methods such as the integrated haplotype statistic and SweepFinder. However, comparisons of the number of haplotypes (K) and segregating sites (S) often provide considerable power to detect selection on microsatellites. We apply this knowledge to a scan of autosomes in the human CEU population (CEPH population sampled from Utah). In addition to the most commonly reported targets of selection in European populations, we identify numerous novel genomic regions that bear highly anomalous haplotype configurations. Using one of these regions-intron 1 of MAGI2-as an example, we show that the anomalous configuration is coincident with a perfect CA repeat of length 22. We conclude that standard genome-wide scans will commonly fail to detect mutationally complex targets of selection but that comparisons of K and S will, in many cases, facilitate their identification.
Figures

Similar articles
-
Microsatellites as targets of natural selection.Mol Biol Evol. 2013 Feb;30(2):285-98. doi: 10.1093/molbev/mss247. Epub 2012 Oct 27. Mol Biol Evol. 2013. PMID: 23104080 Free PMC article.
-
Searching for evidence of positive selection in the human genome using patterns of microsatellite variability.Mol Biol Evol. 2002 Jul;19(7):1143-53. doi: 10.1093/oxfordjournals.molbev.a004172. Mol Biol Evol. 2002. PMID: 12082133
-
A haplotype method detects diverse scenarios of local adaptation from genomic sequence variation.Mol Ecol. 2016 Jul;25(13):3081-100. doi: 10.1111/mec.13671. Epub 2016 Jun 6. Mol Ecol. 2016. PMID: 27135633 Free PMC article.
-
Fitness landscapes of human microsatellites.PLoS Genet. 2024 Dec 30;20(12):e1011524. doi: 10.1371/journal.pgen.1011524. eCollection 2024 Dec. PLoS Genet. 2024. PMID: 39775235 Free PMC article.
-
Challenges in analysis and interpretation of microsatellite data for population genetic studies.Ecol Evol. 2014 Nov;4(22):4399-428. doi: 10.1002/ece3.1305. Epub 2014 Oct 30. Ecol Evol. 2014. PMID: 25540699 Free PMC article. Review.
Cited by
-
Systematic Profiling of Short Tandem Repeats in the Cattle Genome.Genome Biol Evol. 2017 Jan 1;9(1):20-31. doi: 10.1093/gbe/evw256. Genome Biol Evol. 2017. PMID: 28172841 Free PMC article.
-
Integrating Diverse Types of Genomic Data to Identify Genes that Underlie Adverse Pregnancy Phenotypes.PLoS One. 2015 Dec 7;10(12):e0144155. doi: 10.1371/journal.pone.0144155. eCollection 2015. PLoS One. 2015. PMID: 26641094 Free PMC article.
-
Conserved microsatellites may contribute to stem-loop structures in 5', 3' terminals of Ebolavirus genomes.Biochem Biophys Res Commun. 2019 Jun 30;514(3):726-733. doi: 10.1016/j.bbrc.2019.04.192. Epub 2019 May 8. Biochem Biophys Res Commun. 2019. PMID: 31078274 Free PMC article.
-
Global abundance of short tandem repeats is non-random in rodents and primates.BMC Genom Data. 2022 Nov 3;23(1):77. doi: 10.1186/s12863-022-01092-4. BMC Genom Data. 2022. PMID: 36329409 Free PMC article.
-
Fifteen years of genomewide scans for selection: trends, lessons and unaddressed genetic sources of complication.Mol Ecol. 2016 Jan;25(1):5-23. doi: 10.1111/mec.13339. Epub 2015 Sep 16. Mol Ecol. 2016. PMID: 26224644 Free PMC article. Review.
References
Publication types
MeSH terms
Grants and funding
LinkOut - more resources
Full Text Sources
Other Literature Sources
