. 2014 Aug 13:12:63.
doi: 10.1186/s12915-014-0063-7.

Brachyury cooperates with Wnt/β-catenin signalling to elicit primitive-streak-like behaviour in differentiating mouse embryonic stem cells

Brachyury cooperates with Wnt/β-catenin signalling to elicit primitive-streak-like behaviour in differentiating mouse embryonic stem cells

David A Turner et al. BMC Biol. .

Abstract

Background: The formation of the primitive streak is the first visible sign of gastrulation, the process by which the three germ layers are formed from a single epithelium during early development. Embryonic stem cells (ESCs) provide a good system for understanding the molecular and cellular events associated with these processes. Previous work, both in embryos and in culture, has shown how converging signals from both nodal/TGFβR and Wnt/β-catenin signalling pathways specify cells to adopt a primitive-streak-like fate and direct them to undertake an epithelial-to-mesenchymal transition (EMT). However, many of these approaches have relied on genetic analyses without taking into account the temporal progression of events within single cells. In addition, it is still unclear to what extent events in the embryo are able to be reproduced in culture.

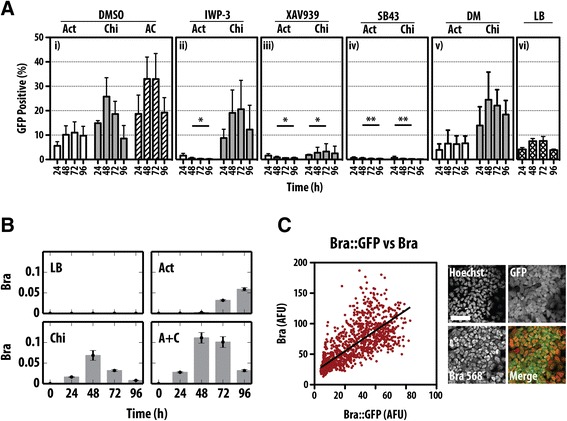
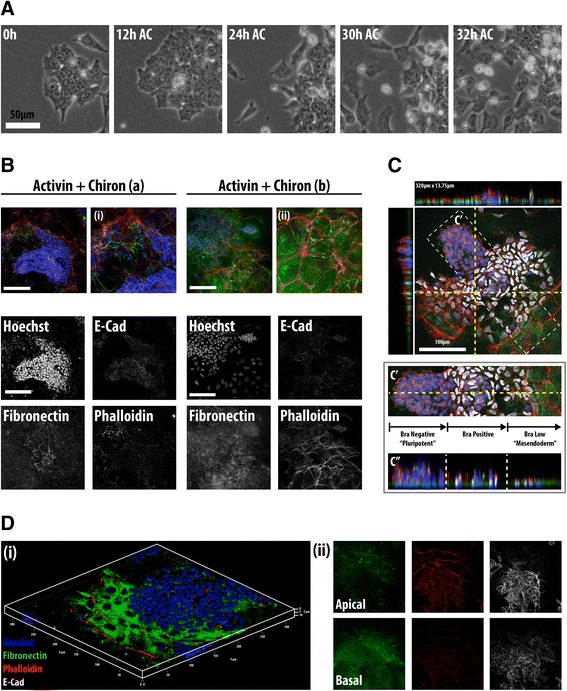
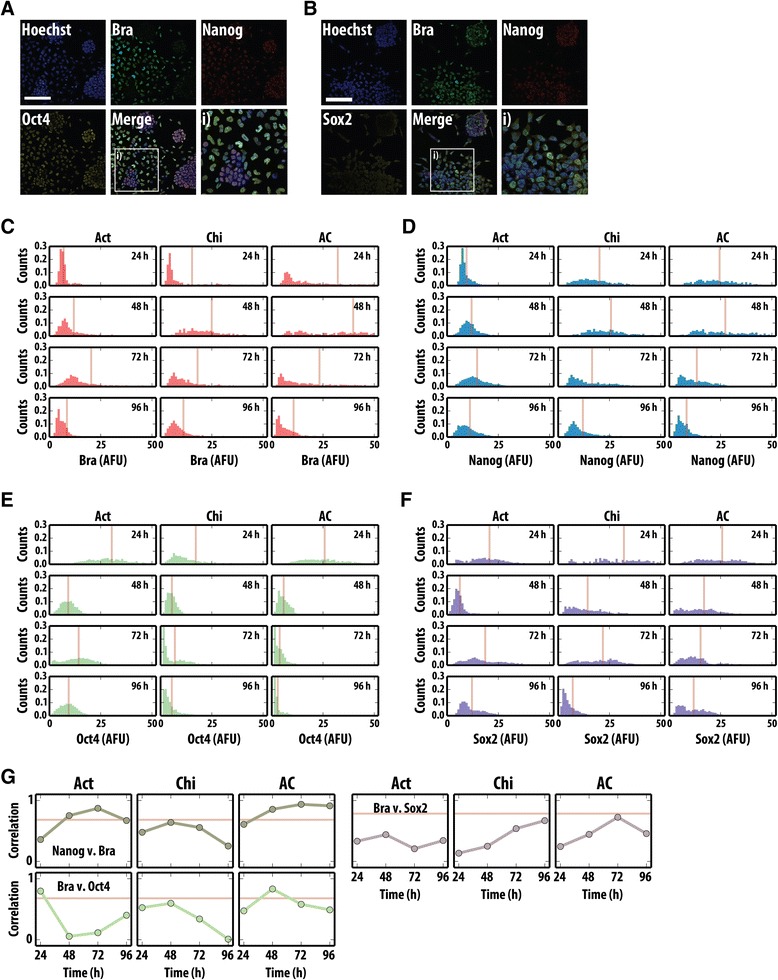
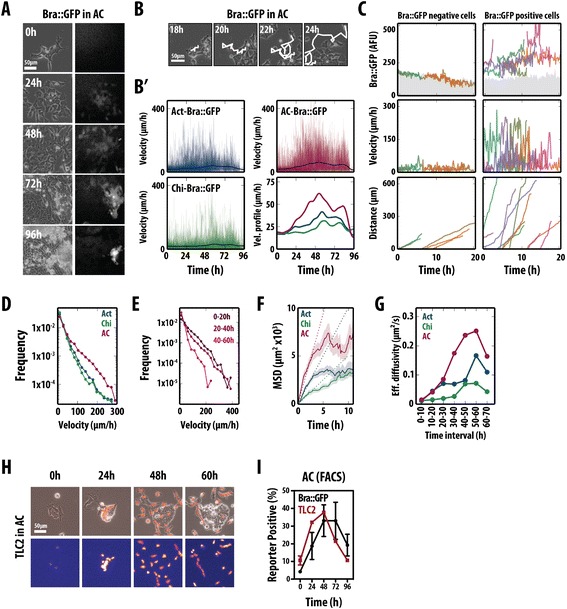
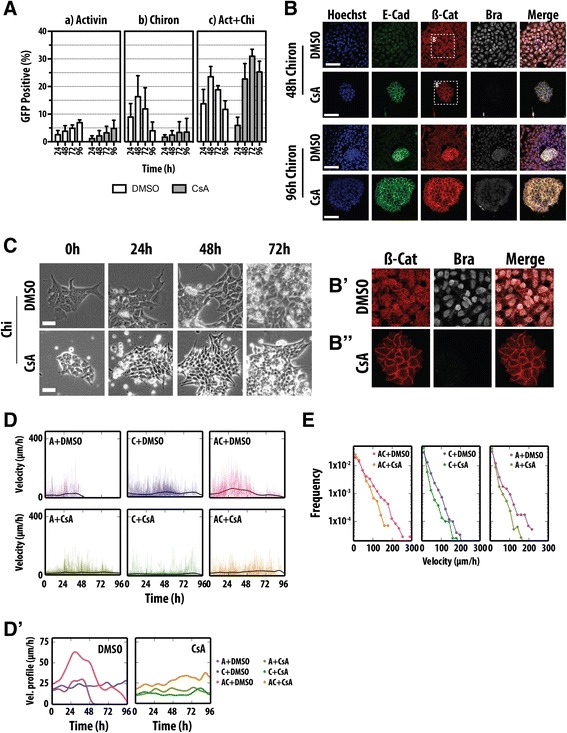
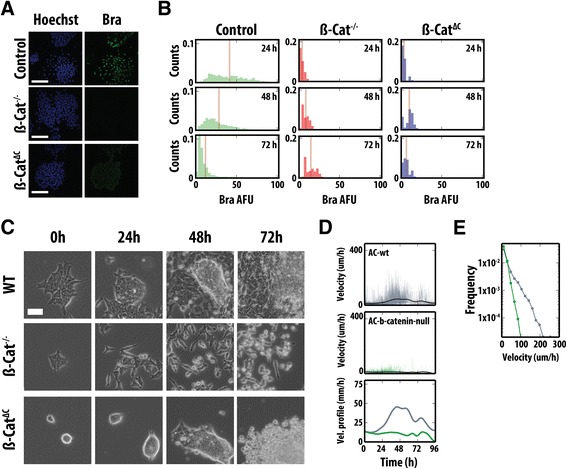
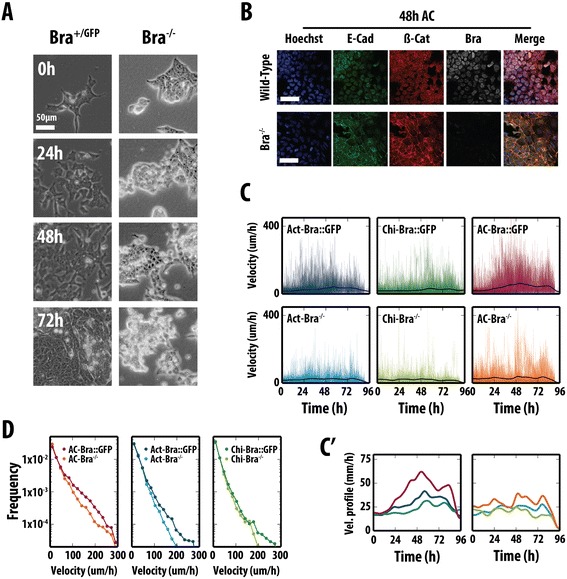
Results: Here, we combine flow cytometry and a quantitative live single-cell imaging approach to demonstrate how the controlled differentiation of mouse ESCs towards a primitive streak fate in culture results in cells displaying many of the characteristics observed during early mouse development including transient brachyury expression, EMT and increased motility. We also find that the EMT initiates the process, and this is both fuelled and terminated by the action of brachyury, whose expression is dependent on the EMT and β-catenin activity.

Conclusions: As a consequence of our analysis, we propose that a major output of brachyury expression is in controlling the velocity of the cells that are transiting out of the primitive streak.


Figures

Figure 1
Figure 1
Induction of Bra expression by activin (Act) and CHIR99021 (Chi) during the differentiation of mESCs. (A) Bra::GFP mESCs were treated with Act, Chi or Act/Chi and dimethyl sulfoxide (DMSO) (i), Act and Chi with the Porcupine inhibitor IWP3, which inhibits the secretion of Wnt proteins (ii), with the tankyrase inhibitor XAV939, which reduces active β-catenin (iii), the nodal/Act receptor inhibitor SB431542 (SB43) (iv) or the BMP inhibitor dorsomorphin (v). A control for long-term pluripotency growth, leukaemia inhibitory factor (LIF) and BMP (LB), is included (vi). Notice that the robust expression of Bra induced by Act and Chi, is suppressed by inhibition of Wnt/β-catenin or nodal/Act signalling but not by BMP inhibition. Measurements were made with GFP-positive cells daily by FACS (±standard deviation from at least three replicates). Single and double asterisks denote P < 0.05 and P < 0.01, respectively, versus DMSO. (B) E14-Tg2A mESCs were grown in LB, Act, Chi or Act/Chi for the indicated durations prior to RNA extraction and quantitative real-time reverse-transcription-polymerase chain reaction (RT-qPCR) analysis for the indicated genes. The average expression level of the RT-qPCR replicates relative to that of glyceraldehyde 3-phosphate dehydrogenase (GAPDH) are shown for a representative experimental replicate. Error bars indicate absolute error of the normalized mean. Notice the transient expression of Bra in Chi and dual Act and Chi compared with the delayed expression in Act. (C) Quantification of Bra::GFP v Bra expression by immunostaining indicates a high correlation (Pearson coefficient of 0.773). Scale bar denotes 50 μm. A + C or AC, activin A + chiron; Act, activin A; AFU, arbitrary fluorescence units; Bra, brachyury; Chi, chiron CHIR99021; DM, dorsomorphin; DMSO, dimethyl sulfoxide; FACS, fluorescence-activated cell sorting; GAPDH, glyceraldehyde 3-phosphate dehydrogenase; GFP, green fluorescent protein; LB, leukaemia inhibitory factor and bone morphogenetic factor; RT-qPCR, quantitative real-time reverse-transcription-polymerase chain reaction.
Figure 2
Figure 2
An EMT is associated with mesendodermal differentiation of E14-Tg2A. (A) Phase-contrast images from live-cell imaging of wild-type (WT) mESCs following Act/Chi. At the start of differentiation, cells begin to loosen up within the colonies, adopt a more motile morphology and become migratory over time. (B,C) Differentiating mESCs were treated with Act/Chi and stained for E-cadherin (B) or brachyury (C and Additional file 2: Figure S2D) together with fibronectin and phalloidin. Panels (a) and (b) in (B) show two separate colonies and their corresponding magnified regions (i and ii) in different phases of an EMT. The decrease in E-cadherin correlates with the appearance of filopodia and the laying down of fibronectin basally. This is clear at the edge of the colony, where these changes are associated with Bra expression (C and Additional file 2: Figure S2C); 320x13.75 μm sections through the colony, indicated by yellow hashed lines illustrate this (C, top). A region of the colony (C' white hashing) shows the EMT phases with corresponding section through the colony (C"m single yellow horizontal line). (D) 3D rendering of E14-Tg2A mESCs in Act/Chi, stained for fibronectin (green), phalloidin (red) and E-cadherin (white). Cells emerging from the colony secrete high levels of fibronectin and have altered F-actin architecture. E-cadherin is obscured due to the rendering process used to generate the 3D image. Individual channels are shown in (ii) illustrating membrane location of E-cadherin within the central colony; EMT initiation results in E-cadherin loss from the membrane. Fibronectin is observed on the basal surface of the colony. Scale bars represent 50 μm in (A) and 100 μm in (B,C,D). Hoechst marks the nuclei in all images. AC, activin A + chiron; Act, activin A; Bra, brachyury; Chi, chiron CHIR99021; E-cad, E-cadherin; EMT, epithelial-to-mesenchymal transition; mESC, mouse embryonic stem cell; WT, wild type.
Figure 3
Figure 3
Quantitative image analysis of Bra, Nanog and Oct4 or Sox2 following treatment with mesendodermal-inducing factors. (A,B) Confocal images of WT mESCs following 48 h Act/Chi treatment stained for brachyury (Bra; green) and Nanog (red) with either Oct4 (A) or Sox2 (B, yellow). Merged images are shown with the corresponding magnified regions denoted by a white box (i). (C-F) Time evolution of the distributions of the expression of brachyury (C), Nanog (D), Oct4 (E) and Sox2 (F) during differentiation. WT E14-Tg2A mESCs treated with Act, Chi or Act/Chi for 24, 48, 72 and 96 h were stained as described (A,B). The nuclei were segmented based on Hoechst staining and the average pixel intensity for each fluorescent channel was quantified. The intensities for brachyury (C), Nanog (D), Oct4 (E) and Sox2 (F) are displayed as histograms for each time point. The bisecting orange lines in each histogram correspond to the mean fluorescence levels. (G) Pearson correlation coefficient for the correlations between Bra and Nanog (top left), Bra and Oct4 (bottom left) and Bra and Sox2 (top right) for the different time points. The horizontal line represents the correlation for LB. Scale bar represents 100 μm. Hoechst stain is used for the nuclei. AC, activin A + chiron; Act, activin A; AFU, arbitrary fluorescence units; Bra, brachyury; Chi, chiron CHIR99021; LB, leukaemia inhibitory factor and bone morphogenetic factor; mESC, mouse embryonic stem cell; WT, wild type.
Figure 4
Figure 4
Live microscopy of Bra::GFP and a β-catenin transcriptional reporter (TLC2) following mesendodermal differentiation. (A) Stills from live imaging of Bra::GFP mESCs in Act/Chi (Additional file 5: Movie M1); phase contrast (left) and fluorescence (right). (B,C) Cells were manually tracked (B) and their velocities (B', C middle), GFP expression (C, top) and distance travelled (C, bottom) were measured. Average velocities for all tracked cells in Act (blue), Chi (green) and Act/Chi (red) (B', bottom right) show that cells in Act/Chi have on average the highest peak velocities, which are reached earlier. (C) Each cell represented by a colour showing that all cells move, but only cells that express Bra move with a high velocity. There seems to be a relationship between the levels of Bra expression, velocity and distance travelled by individual cells. (D) Distribution of individual cell velocities under different conditions. Cells in Act/Chi have a higher proportion of fast movers. (E) Cell velocity increases with time. (F) Mean-squared displacement (MSD) curves representing the range of individual movements of all cells tracked over the whole experiment. (G) Effective diffusion coefficients at different time intervals. Coefficients were estimated by fitting straight lines to the MSD curves obtained when considering cells at different 10 h intervals. (H) Live imaging of the TLC2 Wnt/β-catenin reporter in Act/Chi (Additional file 6: Movie M2). Differentiation results in reporter up-regulation before cells initiate the EMT and down-regulation as cells leave the colonies. (I) FACS analysis of Bra::GFP and TLC2 reporters revealing activation of β-catenin transcriptional activity relative to activation of Bra within a population of cells. Average of three replicate experiments ± standard deviation. Scale bars represent 50 μm. AC, activin A + chiron; Act, activin A; Bra, brachyury; Chi, CHIR99021; FACS, fluorescence-activated cell sorting; Eff., effective; GFP, green fluorescent protein; MSD, mean-squared displacement.
Figure 5
Figure 5
An EMT event is required for Bra::GFP expression. (A) Expression of Bra::GFP in mESCs subject to (a) Act, (b) Chi and (c) Act/Chi, in the presence of CsA (3 μM; grey) or vehicle (DMSO; white) analysed by FACS. Error bars show standard deviation, n = 3. (B,B',B") E14-Tg2A mESCs subject to Chi in the presence of CsA (3 μM) or DMSO, stained for Hoechst, E-cadherin, β-catenin and Bra. Scale bars denote 50 μm. In the presence of CsA, E-cadherin is not effectively cleared from the membrane, β-catenin does not enter the nucleus and there is no effective expression of Bra. (C) Stills from live imaging of E14-Tg2A mESCs in Chi with DMSO or CsA. Notice that in CsA, cells stretch out filopodia but do not undergo an EMT. Scale bars denote 50 μm. (D) Cell velocities (μm/h) measured from multiple films as in (C). Tracking for Act + DMSO ceased after 48 h due to loss of focus. Refer to Figure 4 for comparison. Analysis of the average instant velocities shows that CsA reduces the movement of the cells. (E) Distribution of instant velocities. AC, activin A + chiron; Act, activin A; β-cat, β-catenin; Bra, brachyury; Chi, chiron CHIR99021; CsA, cyclosporine A; DMSO, dimethyl sulfoxide; E-Cad, E-cadherin; EMT, epithelial-to-mesenchymal transition; GFP, green fluorescent protein; Vel. velocity.
Figure 6
Figure 6
β-catenin transcriptional activity and expression of Nanog are required for Bra expression and associated EMT. (A) Bra expression in E14-Tg2A, β-catenin−/− and β-cateninΔC cells differentiated in Act and Chi. Hoechst stain is on the left-hand side. (B) Time evolution of the distribution of Bra expression in cells as in (A). β-catenin transcriptional activity is required for Bra expression. See text for details. (C) Live imaging of β-catenin mutants in Act/Chi. (D) Individual cell velocities (μm/h), and the average velocity profile for each cell line (indicated by colours) in Act/Chi. (E) The distribution of velocities over time. Scale bars denote 50 μm. Act, activin A; AFU, arbitrary fluorescence units; β-cat, β-catenin; Bra, brachyury; Chi, chiron CHIR99021; EMT, epithelial-to-mesenchymal transition; Vel., velocity; WT, wild type.
Figure 7
Figure 7
Bra is required for an EMT event during mesendodermal differentiation. (A) Phase-contrast images from live imaging of Bra::GFP (Bra+/GFP) and Bra−/− mESCs in Act and Chi. Bra::GFP stills were shown in Figure 4A. In the absence of Bra, cells do not undergo a full EMT. (B) E14-Tg2A and Bra−/− mESCs after 48 h in Act and Chi, immunostained for E-cadherin, β-catenin and Bra and imaged by confocal microscopy. Scale bars indicate 50 μm. Hoechst stain marks the nucli. In the absence of Bra, E-cadherin and β-catenin are not effectively cleared from the membrane. (C,C') Instant velocities of Bra::GFP cells and Bra null cells in Act, Chi or Act/Chi. The thick black line in the individual graphs indicates the average velocity for each condition, and is displayed in greater detail in (C'). (D) Histograms of instant cell velocities as measured from frame-to-frame displacements for both Bra::GFP and Bra−/− mESCs. All the Bra::GFP live imaging data was displayed in Figure 4. AC, activin A + chiron; Act, activin A; Bra, brachyury; Chi, chiron CHIR99021; Eff., effective; EMT, epithelial-to-mesenchymal transition; FACS, fluorescence-activated cell sorting; GFP, green fluorescent protein; mESC, mouse embryonic stem cell.

Similar articles

Cited by

References

    1. Wolpert L, Tickle C. Principles of Development. New York, USA: Oxford University Press; 2010.
    1. Martinez Arias A, Stewart A. Molecular Principles of Animal Development. Oxford, UK: Oxford University Press; 2002.
    1. Gilbert SF. Developmental Biology. Sinauer Associates Inc: Sunderland, Massachusetts, USA; 2013.
    1. Ramkumar N, Anderson KV. SnapShot: mouse primitive streak. Cell. 2011;146:488. doi: 10.1016/j.cell.2011.07.028. - DOI - PubMed
    1. Solnica-Krezel L, Sepich DS. Gastrulation: making and shaping germ layers. Annu Rev Cell Dev Biol. 2012;28:687–717. doi: 10.1146/annurev-cellbio-092910-154043. - DOI - PubMed

Publication types

LinkOut - more resources