. 2014 Aug 15;5(15):6437-52.
doi: 10.18632/oncotarget.2237.

A 5-gene classifier from the carcinoma-associated fibroblast transcriptomic profile and clinical outcome in colorectal cancer

Affiliations

A 5-gene classifier from the carcinoma-associated fibroblast transcriptomic profile and clinical outcome in colorectal cancer

Mireia Berdiel-Acer et al. Oncotarget. .

Abstract

Based on 108 differentially expressed genes between carcinoma-associated fibroblasts (CAFs) and paired normal colonic fibroblasts we recently reported, a 5-gene classifier for relapse prediction in Stage II/III colorectal cancer (CRC ) was developed. Its predictive value was validated in datasets GSE17538, GSE33113 and GSE14095. An additional validation was performed in a metacohort (n=317) and 142 CRC patients by means of RT-PCR. The 5-gene classifier was significantly associated with increased relapse risk and death from CRC across all validation series of Stage II/III patients used. Multivariate Cox regression analyses confirmed the independent prognostic value of the stromal classifier (HR=2.67; P=0.002). Post-test probabilities provided evidence of the suitability of the 5-gene classifier in clinical practice, identifying a subgroup of Stage-II patients who were at high risk of relapse. Moreover, the a priory worst prognosis mesenchymal subtype of tumours can be stratified according to the physiological status of their carcinoma-associated fibroblasts. In conclusion the CAFs-derived 5-gene classifier provides more accurate information about outcome than conventional clinicopathological criteria and it could be useful to take clinical decisions, especially in Stage II. Additionally, the classifier put into relevance the CAF's intratumoral heterogeneity and might contribute to find relevant targets for depleting adequate CAFS subtypes.


Conflict of interest statement

The is no conflict of interest of any form.

Figures
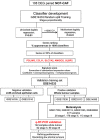
Figure 1
Figure 1. Recurrence classifier development
The 5-gene classifier is derived from a 108-gene signature of differentially expressed genes (DEGs) between carcinoma-associated fibroblasts (CAFs) and paired normal colonic fibroblasts (NCFs) (Molecular Oncology 10.1016/j.molonc.2014.04.006). To develop a prognostic classifier we obtained RMA expression values of the 108 DEGs from 135 Stage II and III cases (GSE14333; excluding non-recurrent patients with a follow up of < 3 years; 87 without 48 with recurrence), we used the random resampling procedure to maintain stage proportionality, and divided the initial 135 cases into training and test sets (66% and 33% of cases, respectively). The latter was not involved in gene selection in order to avoid model overfitting. Transcript cluster IDs corresponding to the 108 DEGs (Affymetrix GeneChip Human Gene 1.0 ST Array) between NCF and CAF were mapped to probe set IDs in GSE14333 (Affymetrix Human Genome U133A Plus 2.0 Array). We did a univariate binary logistic regression for each gene, using recurrence as the dependent variable. We chose genes for which p < 0.01 to model an L1 penalized GLMNET multivariate logistic regression in the training set. We then ran the model with the validation dataset. We repeated this process 1000 times, obtaining 1000 classifiers. We recorded all 1000 intermediate signatures, considering only genes and discarding β regression coefficients in order to apply the same biological relevance (same weight) to all genes. We ranked the percentage of times each candidate gene appeared in the signatures, selecting those present in > 50% of signatures for the final classifier. The selected genes were PDLIM3, AMIGO2, SLC7A2, ULBP2 and CCL11. A recurrence score for each sample was computed as the sum of the z-scores of each gene. No gene level parameters were estimated in order to assign the same biological relevance to all five genes (as detailed above), and coefficients were established as 1 for overexpressed genes in CAF vs. NCF (PDLIM3, SLC7A2, ULBP2 and AMIGO2; risk genes) and -1 for underexpressed genes in CAF vs. NCF (CCL11, protective gene). The genes were firstly negatively validated in two datasets of epithelial cell-enriched samples to test their stromal specificity. Moreover, the classifier was validated in silico in independent datasets of whole-tumor samples and in an independent cohort of 142 cases of Stage II/III colorectal cancers by quantitative real-time PCR. To conduct the Kaplan-Meier analysis, patients were segregated in two risk groups using the cut off obtained in the training dataset (cut off classifier score = 1.1328; third tertile; > 1.1328 high-risk of relapse; < 1.1328, low-risk of relapse). The third tertile is approximately the relapse prevalence in colorectal cancer (approximately 33.3%).
Figure 2
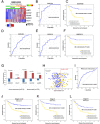
Figure 2. (A) Heatmap of expression values of the 5 genes of the classifier in patients of the training dataset
The cut off 1.1328 (the 3rd tertile of the score) segregates patients in two groups of risk. Performance of the 5-gene classifier in the validation dataset GSE17538, (B) (ROC curve), and (C) Kaplan-Meier analysis of disease free survival. High expression patients (yellow) have a hazard ratio 6.08 times higher to relapse than low expression patients (blue). (D) To confirm the prognostic stromal classifier we used another independent dataset (GSE14095), displaying a AUC = 0.68. No survival time information was available for this dataset in order to display Kaplan-Meier curves. An additional validation (E) was performed with GSE33113 (Stage II colorectal cancer patients). (F) High expression patients (yellow) have a hazard ratio 2.62 times higher to relapse than low expression patients (blue), P = 0.036. In this dataset, for a unit increase in the classifier score, the risk of relapse increases by 1.206 (95% CI = 1.036 - 1.403; P = 0.016). (G) Standardized expression values of the five genes in the metanalysis cohort (n=317), including GSE17538, GSE33133, GSE31595 and GSE26892. Four genes (AMIGO2, ULBP2, PDLIM3 and SLC7A2) are significantly higher in recurrent tumors compared to non-recurrent tumors (statistical significance assessed by the Student's t-test). (H) Scatter plot of the 317 patients of the meta-cohort according to the 5-gene classifier score (yellow dots recurrent patients, blue dots non-recurrent patients The red dotted line is the cut off obtained in the training dataset to categorize patients according to risk of relapse. The receiver operating characteristic curve describes the performance of the 5-gene classifier in this large cohort (I). (J to L) Kaplan-Meier curves in the meta-cohort.
Figure 3
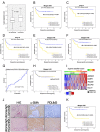
Figure 3. Prognostic information in the PCR independent validation
(A) Mean values of the 5-gene signature score according to patient recurrence in the PCR cohort of 142 samples (43 recurrent and 99 non-recurrent); t-test, P = 0.007. (B-D) Kaplan-Meier plots for disease-free survival in all stages and Stage II or Stage III alone. Considering only the 68 patients who did not receive adjuvant chemotherapy, the 5-gene classifier is associated with recurrence (HR = 3.79, 95% CI = 1.72 – 8.36, P = 0.001; Figure 3E). (F) Kaplan-Meier plots for disease-specific survival in all stages. (G) Receiver operating characteristic curve describing the absence of predictive power for the recurrence of the collagen score. (H) Using the 3rd tertile of the collagen score as a cut off, Kaplan-Meier survival plot shows that the collagen score provides no prognostic information in terms of disease-free survival in the PCR cohort. Thus, tumors with high collagen expression have the same outcome than low collagen tumors. The collagen score does not provide prognostic information. Higher collagen values are not associated with a worse outcome. (I) Heatmap showing individual genes included in the classifier on the basis of their expression in the PCR cohort. The cut-off value obtained from the training dataset is represented by the change from green to red in the horizontal bar over the heatmap, which defines the two risk groups. The light grey and black boxes below the heatmap depict the samples identified as low or high collagen according to the collagen score (defined as the average expression of COL1A1 and COL3A1). Our results suggest that the prognostic value is determined by the physiological status of the CAFs rather than their quantity. In these photomicrographs (J) we illustrate two colorectal tumors, both considered as “high stroma” because of the large quantity of desmoplasia (H-E staining), strong positivity for alpha smooth muscle actin (α-SMA), but reflecting a distinct transcriptomic status with respect to PDLIM3 staining. In the top right panel, CAFs display no staining for PDLIM3, one of the five genes of the classifier, and in addition, the tumor is classified as low-risk, according to the mRNA expression values of the five genes. Conversely, in the bottom right panel, CAFs display intense PDLIM3 staining, and the tumor is considered high-risk when considering the expression of all five genes. (K) Our hypothesis is that the performance of the 5-gene classifier increases if considering specimens with a minimum number of fibroblasts. Samples with very low levels of fibroblasts will have a very poor representation of mRNA transcripts from fibroblast origin and will therefore be misclassified. As a proof of concept, we selected samples with a collagen score above the 25th percentile, excluding samples with poor collagen scores. This proof of concept can be done since low Collagen score tumors have the same outcome than high Collagen score tumors, as illustrated above. Additionally the proportion of stages and events is maintained in this subanalysis. Kaplan-Meier survival plots after excluding samples below the 25th percentile of the collagen score (n = 107 patients). The 5-gene classifier identifies two risks groups. Five-year DFS and DSS (not shown) survival rates according to the 5-gene signature score improved significantly excluding very low stroma patients.

Similar articles

Cited by

References

    1. Ferlay J, Shin HR, Bray F, Forman D, Mathers C, Parkin DM. Estimates of worldwide burden of cancer in 2008: GLOBOCAN 2008. Int J Cancer. 127;12(2893):2917–2917. - PubMed
    1. O'Connell JB, Maggard MA, Ko CY. Colon cancer survival rates with the new American Joint Committee on Cancer sixth edition staging. J Natl Cancer Inst. 2004;96(19):1420–1420. - PubMed
    1. Andre T, Boni C, Mounedji-Boudiaf L, Navarro M, Tabernero J, Hickish T, Topham C, Zaninelli M, Clingan P, Bridgewater J, Tabah-Fisch I, de Gramont A. Oxaliplatin, fluorouracil, and leucovorin as adjuvant treatment for colon cancer. The New England journal of medicine. 2004;350(23):2343–2343. - PubMed
    1. Gray R, Barnwell J, McConkey C, Hills RK, Williams NS, Kerr DJ. Adjuvant chemotherapy versus observation in patients with colorectal cancer: a randomised study. Lancet. 2007;370(9604):2020–2020. - PubMed
    1. Ragnhammar P, Hafstrom L, Nygren P, Glimelius B. A systematic overview of chemotherapy effects in colorectal cancer. Acta oncologica (Stockholm, Sweden) 2001;40(2-3):282–308. - PubMed

Publication types