Postnatal hyperoxia exposure differentially affects hepatocytes and liver haemopoietic cells in newborn rats
- PMID: 25115881
- PMCID: PMC4130630
- DOI: 10.1371/journal.pone.0105005
Postnatal hyperoxia exposure differentially affects hepatocytes and liver haemopoietic cells in newborn rats
Abstract
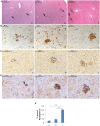
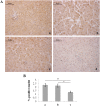
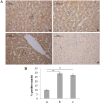
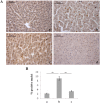
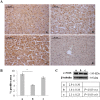
Premature newborns are frequently exposed to hyperoxic conditions and experimental data indicate modulation of liver metabolism by hyperoxia in the first postnatal period. Conversely, nothing is known about possible modulation of growth factors and signaling molecules involved in other hyperoxic responses and no data are available about the effects of hyperoxia in postnatal liver haematopoiesis. The aim of the study was to analyse the effects of hyperoxia in the liver tissue (hepatocytes and haemopoietic cells) and to investigate possible changes in the expression of Vascular Endothelial Growth Factor (VEGF), Matrix Metalloproteinase 9 (MMP-9), Hypoxia-Inducible Factor-1α (HIF-1α), endothelial Nitric Oxide Synthase (eNOS), and Nuclear Factor-kB (NF-kB). Experimental design of the study involved exposure of newborn rats to room air (controls), 60% O2 (moderate hyperoxia), or 95% O2 (severe hyperoxia) for the first two postnatal weeks. Immunohistochemical and Western blot analyses were performed. Severe hyperoxia increased hepatocyte apoptosis and MMP-9 expression and decreased VEGF expression. Reduced content in reticular fibers was found in moderate and severe hyperoxia. Some other changes were specifically produced in hepatocytes by moderate hyperoxia, i.e., upregulation of HIF-1α and downregulation of eNOS and NF-kB. Postnatal severe hyperoxia exposure increased liver haemopoiesis and upregulated the expression of VEGF (both moderate and severe hyperoxia) and eNOS (severe hyperoxia) in haemopoietic cells. In conclusion, our study showed different effects of hyperoxia on hepatocytes and haemopoietic cells and differential involvement of the above factors. The involvement of VEGF and eNOS in the liver haemopoietic response to hyperoxia may be hypothesized.
Conflict of interest statement
Figures




Similar articles
-
pPKCα mediated-HIF-1α activation related to the morphological modifications occurring in neonatal myocardial tissue in response to severe and mild hyperoxia.Eur J Histochem. 2012 Jan 31;56(1):e2. doi: 10.4081/ejh.2012.e2. Eur J Histochem. 2012. PMID: 22472890 Free PMC article.
-
[Dynamic changes in vascular endothelial growth factor and endothelial nitric oxide synthase in lungs of premature rats after hyperoxia exposure].Zhongguo Dang Dai Er Ke Za Zhi. 2007 Oct;9(5):473-8. Zhongguo Dang Dai Er Ke Za Zhi. 2007. PMID: 17937862 Chinese.
-
Hepatic response to chronic hypoxia in experimental rat model through HIF-1 alpha, activator protein-1 and NF-kappa B.Histol Histopathol. 2013 Apr;28(4):463-71. Epub 2013 Jan 16. Histol Histopathol. 2013. PMID: 23322610
-
Kidney Injuries and Evolution of Chronic Kidney Diseases Due to Neonatal Hyperoxia Exposure Based on Animal Studies.Int J Mol Sci. 2022 Jul 31;23(15):8492. doi: 10.3390/ijms23158492. Int J Mol Sci. 2022. PMID: 35955627 Free PMC article. Review.
-
Effects of Hyperoxia on Aging Biomarkers: A Systematic Review.Front Aging. 2022 Jan 3;2:783144. doi: 10.3389/fragi.2021.783144. eCollection 2021. Front Aging. 2022. PMID: 35822043 Free PMC article. Review.
Cited by
-
Local anaesthetics upregulate nitric oxide generation in cord blood and adult human neutrophils.Sci Rep. 2019 Jan 24;9(1):569. doi: 10.1038/s41598-018-37090-9. Sci Rep. 2019. PMID: 30679708 Free PMC article.
-
Effects of vitamin B-6 supplementation on oxidative stress and inflammatory response in neonatal rats receiving hyperoxia therapy.J Food Drug Anal. 2018 Jul;26(3):1086-1096. doi: 10.1016/j.jfda.2018.01.004. Epub 2018 Feb 2. J Food Drug Anal. 2018. PMID: 29976401 Free PMC article.
-
ELBW survivors in early adulthood have higher hepatic, pancreatic and subcutaneous fat.Sci Rep. 2016 Aug 17;6:31560. doi: 10.1038/srep31560. Sci Rep. 2016. PMID: 27530702 Free PMC article.
-
The Impact of Moderate Chronic Hypoxia and Hyperoxia on the Level of Apoptotic and Autophagic Proteins in Myocardial Tissue.Oxid Med Cell Longev. 2018 Aug 16;2018:5786742. doi: 10.1155/2018/5786742. eCollection 2018. Oxid Med Cell Longev. 2018. PMID: 30186545 Free PMC article.
-
Reference Value Profile for Healthy Individuals From the Aljouf region of Saudi Arabia.J Hematol. 2017 Mar;6(1):6-11. doi: 10.14740/jh316e. Epub 2017 Mar 21. J Hematol. 2017. PMID: 32300385 Free PMC article.
References
-
- Saugstad OD (2005) Oxidative stress in the newborn - a 30-year perspective. Biol Neonate 88: 228–236. - PubMed
-
- Deulofeut R, Critz A, Adams-Chapman I, Sola A (2006) Avoiding hyperoxia in infants < or = 1250 g is associated with improved short- and long-term outcomes. J Perinatol 26: 700–705. - PubMed
-
- Deuber C, Terhaar M (2011) Hyperoxia in very preterm infants: a systematic review of the literature. J Perinat Neonatal Nurs 25: 268–274. - PubMed
-
- Sturman JA, Gaull G, Raiha NC (1970) Absence of cystathionase in human fetal liver: is cystine essential? Science 169: 74–76. - PubMed
-
- Buonocore G, Perrone S, Bracci R (2001) Free radicals and brain damage in the newborn. Biol Neonate 79: 180–186. - PubMed
MeSH terms
Substances
LinkOut - more resources
Full Text Sources
Other Literature Sources
Medical
Miscellaneous

