. 2014 Aug 13:5:4627.
doi: 10.1038/ncomms5627.

Invertebrate extracellular phagocyte traps show that chromatin is an ancient defence weapon

Affiliations

Invertebrate extracellular phagocyte traps show that chromatin is an ancient defence weapon

Calum T Robb et al. Nat Commun. .

Abstract

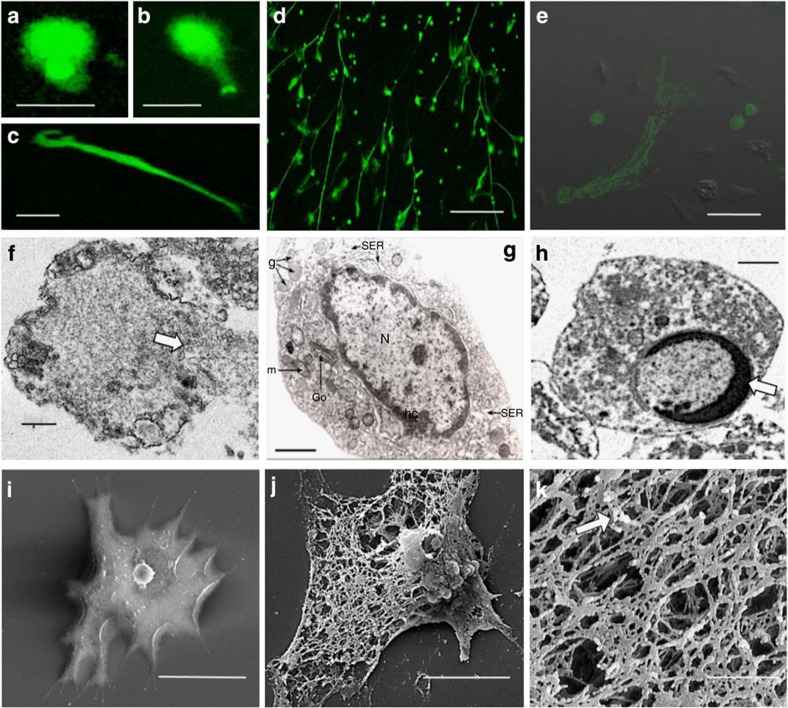
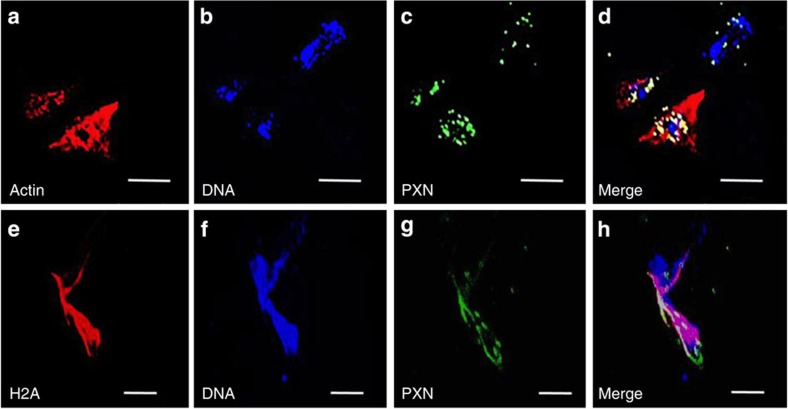
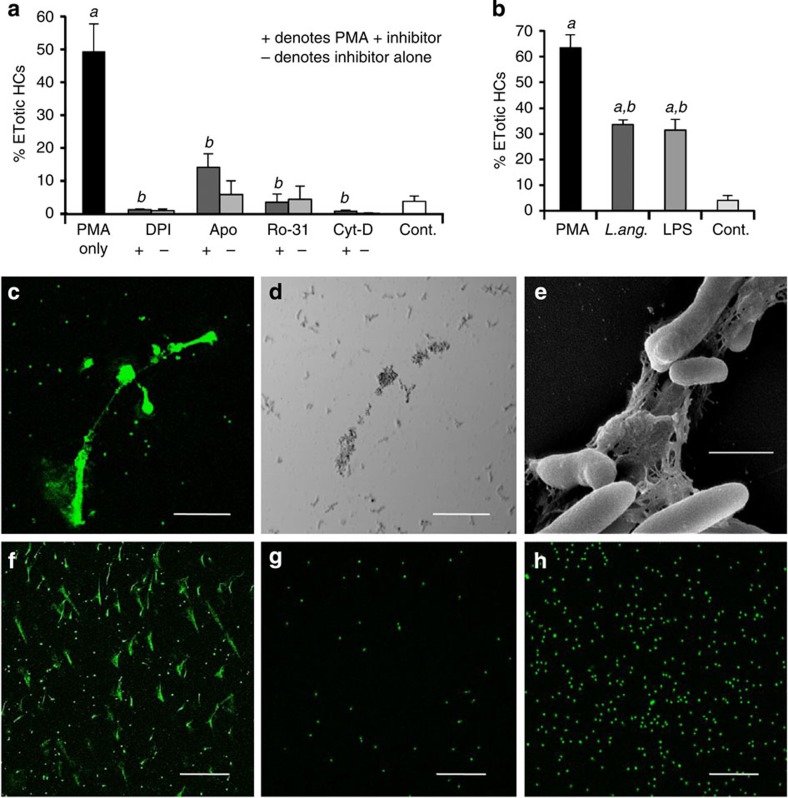
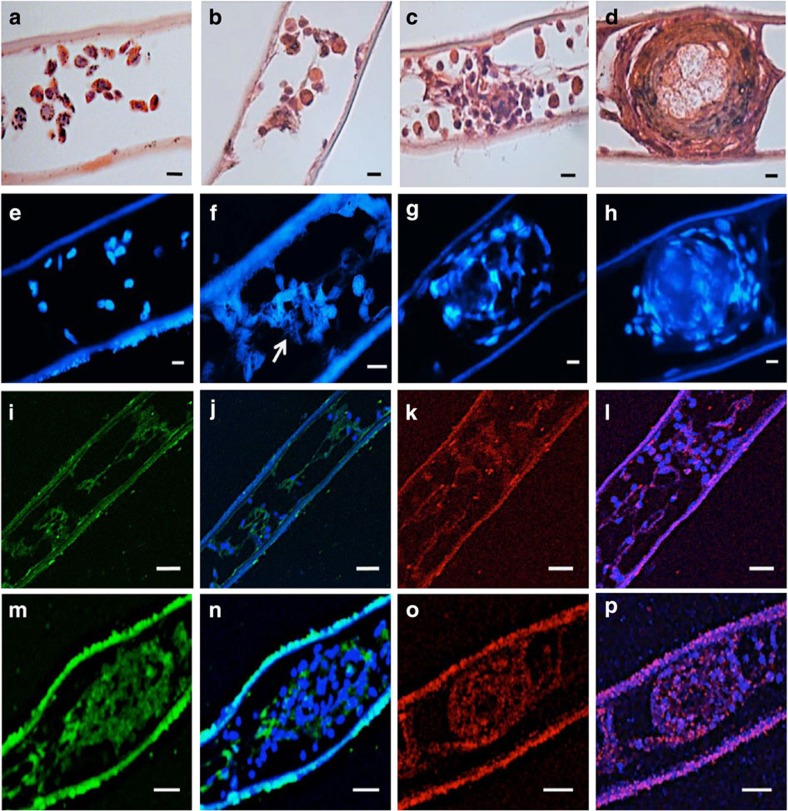
Controlled release of chromatin from the nuclei of inflammatory cells is a process that entraps and kills microorganisms in the extracellular environment. Now termed ETosis, it is important for innate immunity in vertebrates. Paradoxically, however, in mammals, it can also contribute to certain pathologies. Here we show that ETosis occurs in several invertebrate species, including, remarkably, an acoelomate. Our findings reveal that the phenomenon is primordial and predates the evolution of the coelom. In invertebrates, the released chromatin participates in defence not only by ensnaring microorganisms and externalizing antibacterial histones together with other haemocyte-derived defence factors, but crucially, also provides the scaffold on which intact haemocytes assemble during encapsulation; a response that sequesters and kills potential pathogens infecting the body cavity. This insight into the early origin of ETosis identifies it as a very ancient process that helps explain some of its detrimental effects in mammals.


Figures

Figure 1
Figure 1. Chromatin discharge by separated HCs from C. maenas in vitro.
(ae) Unfixed HCs in monolayer cultures stained with Sytox Green. (a,b) Diffuse extracellular chromatin at 3 h, 1.0 μM PMA. (c) Spread extracellular chromatin at 24 h, 0.1 μM PMA. (ac) Scale bar, 30 μm. (d) Extended extracellular chromatin strands (24 h, 0.1 μM PMA ). Scale bar, 300 μm. (e) Merged phase contrast and fluorescence images of an ETotic HC at 24 h (0.1 μM PMA). Also evident are viable cells and stained necrotic/late apoptotic cells with round stained nuclei. Scale bar, 50 μm. (f) TEM of a HC (24 h, 0.1 μM PMA) showing swelling of uncondensed chromatin, nuclear membrane breakdown and chromatin discharge from the cell at a breach point (arrow). (g) TEM of a control, unstimulated HC, N, nucleus with intact membrane and rim of condensed heterochromatin (hc) at the periphery. Go, Golgi body, g, granules, m, mitochondrion, SER, smooth endoplasmic reticulum. (h) TEM of an apoptotic HC showing an intact nuclear membrane with a thick, crescent shaped rim of condensed chromatin (arrow). (fh) Scale bars, 1 μm. (i) SEM of control HC. Scale bar, 20 μm. (j) SEM of ETotic HC (24 h, 0.1 μM PMA). Scale bar, 5 μm. (k) SEM detail of extracellular chromatin released from a HC (24 h, 0.1 μM PMA). Arrow indicates granules studded on the extracellular mesh. Scale bar, 1 μm.
Figure 2
Figure 2. Immunocytochemical analysis of chromatin released from HCs of C. maenas in vitro.
(ad) Localization of actin, DNA or PXN in an ETotic haemocyte (top right) and two non-ETotic haemocytes (bottom left), 24 h incubation with 0.1 μM PMA. (a) Actin shown by rhodamine phalloidin. (b) Visualization of DNA by Draq 5. (c) Localization of PXN, by anti-myeloperoxidase (MPO) antibody. (d) Merge of ac. All scale bars, 25 μm. (eh) Localization of histone H2A, DNA or PXN in a different ETotic cell. (e) Localization of H2A. (f) Visualization of DNA by Draq 5. (g) Localization of PXN, by anti-MPO antibody. (h) Merge of eg. Note H2A co-localizes with extracellular DNA and PXN. All scale bars, 20 μm.
Figure 3
Figure 3. Chromatin release in cellular defences of C. maenas in vitro.
(a) Percentage of C. maenas HCs following PMA treatment (24 h, 0.1 μM) or PMA plus the inhibitors DPI (2 μM), apocynin (Apo) (50 μM), Ro-31-8220 (Ro-31) (1 μM), cytochalasin D (Cyt-D) (10 μM) or left untreated (Cont.). Values are mean±s.e.m., n=3. Significant differences between PMA treatments and untreated controls denoted by a; Significant differences between PMA and PMA +/− inhibitor denoted by b. All P values are <0.001, one-way analysis of variance (ANOVA) with Student–Newman–Keuls (SNK) post hoc test. (b) Percentage of ETotic C. maenas HCs following treatment with PMA (0.1 μM), live L. anguillarum (3 × 10⁵ ml−1) or LPS (0.1 μg ml−1) compared with controls. All cultures incubated at 10 °C for 24 h. Values are mean±s.e.m., n=3. Significant differences between the control and PMA, LPS or L. anguillarum are indicated by a. Significant differences between PMA and LPS or L. anguillarum are indicated by b. All P values are <0.001, one-way ANOVA with SNK post hoc test. (c) Unfixed, ETotic HCs (24 h, L. anguillarum (3 × 10⁴ ml−1) stained with Sytox Green. Stained small dots in background are bacteria. (d) Phase contrast view of (c). (c,d) Scale bar, 75 μm. (e) SEM of chromatin released from an HC, trapping L. anguillarum. Scale bar, 1 μm. (fh) Effect of PMA (24 h, 0.1 μM) on other haemocyte populations, stained with Sytox Green. (f) ETotic SGCs. (g) Non-ETotic prohaemocytes. (h) Non-ETotic GCs. (fh) Scale bars, 300 μm.
Figure 4
Figure 4. In vivo role of ETosis during host defence in C. maenas.
(ad) Haematoxylin and eosin-stained paraffin wax sections of gill lamellae at various incubation periods after 100 μl injection of LPS (20 μg ml−1) or saline. (a) Control, 24 h after injection of sterile saline. (b) Part of a gill lamella 1 h after LPS treatment. (c) Early capsule formed 3 h after LPS treatment. (d) Fully formed capsule 24 h after LPS injection. (eh) 2-(4-amidinophenyl)-1H-indole-6-carboxamidine (DAPI)-stained paraffin wax sections of gill lamellae after 100 μl injection of LPS (20 μg ml−1) or saline. (e) Control, saline treatment (24 h). Epibionts are evident on the external (seawater) surface of the lower lamella surface and there is no haemocyte clumping or externalized chromatin. (f) 1 h post LPS treatment showing ETotic cells within a gill lamella. Arrow indicates likely externalized chromatin. (g) Haemocyte clump 3 h post LPS treatment. (h) Fully formed capsule 24 h post LPS treatment. (il) Immunohistochemical staining of haemocyte aggregations formed at 1 h post LPS treatment. (i) PXN visualization with anti-MPO antibody. (j) Merge of i with same section stained with TO-PRO-3 iodide to reveal DNA. (k) Visualization of H2A in a different area of lamella. (l) Merge of k with same section stained with TO-PRO-3 iodide. (mp) Immunohistochemical staining of a haemocyte clump 3 h post LPS treatment. (m) Visualization of PXN with anti-MPO antibody. (n) Merge of m with same section stained with TO-PRO-3 iodide. Note the mostly extracellular location of PXN. (o) Visualization of H2A in a different clump. (p) Merge of o with same section stained with TO-PRO-3 iodide. H2A co-localization is pronounced and occurs throughout clump structure. All scale bars, 20 μm.
Figure 5
Figure 5. ETosis during the formation of haemocyte clumps in suspension culture.
(ad) Diff-Quik stained cytocentrifuge preparations of unseparated C. maenas haemocytes. (a) 24 h, control (no PMA). Scale bar, 100 μm (b) 3 h, 0.1 μM PMA. Scale bar, 20 μm. (c) 24 h, 0.1 μM PMA. Scale bar, 100 μm. (d) Detail of clump (24 h) showing extruded material permeating intact cells. Scale bar, 20 μm. (eh) Sytox Green stained cytocentrifuge preparations. (e) ETosis in small clump 1 h (0.1 μM PMA). (f) Clump showing intact haemocytes entrapped by extracellular chromatin (3 h 0.1 μM PMA). (g) 24 h, 0.1 μM PMA. Clump showing strands of chromatin. (h) Detail showing extracellular chromatin suffused through the cell matrix (24 h). Scale bars (e,f,h) 20 μm, (g) 100 μm. (in) Haemocyte clumps formed in PMA only, PMA+DPI or PMA+DNase. All incubations 10 °C. (i,j) solid columns=PMA only, open columns=PMA+DNAse-1, grey columns=PMA+DPI. Values are mean±s.e.m. of one representative experiment from three independent experiments. Significant differences between PMA-only treatments over time denoted by a. Significant differences between PMA-only and PMA+DNAse or PMA+DPI within one time point indicated by b, one-way analysis of variance with Student–Newman–Keuls post hoc test. (i) Clump size. Values are mean±s.e.m. (n=6–52). PMA 1 h versus 24 h, P<0.01; PMA 3 h versus 24 h and PMA versus PMA+DNAse-1, both P<0.001; PMA versus PMA+DPI P<0.05. (j) Number of haemocyte clumps (that is, >20 haemocytes in close contact). Values are mean number per field of view (FoV)±s.e.m. (n=6). PMA only 1 h versus 24 h, P<0.01. PMA only 1 h versus 3 h, and 3 h versus 24 h, both P<0.001. PMA versus PMA+DNAse, P<0.001; PMA versus PMA+DPI P<0.05. (km) Diff-Quik™ stained cytocentrifuge haemocyte preparations. (k) 24 h PMA+DPI. Compare with c. Arrows indicate degranulated cells. Scale bar, 200 μm. (l) Small, loose haemocyte clump, 3 h PMA+DNAse-1. Compare with b, f. Scale bar, 20 μm. (m) Haemocyte clump, 24 h PMA+DNAse-1. Compare with c,d. Scale bar, 40 μm. (n) Haemocyte clump, 24 h PMA+DNAse-1, Sytox Green stain. Compare with g,h. Scale bar, 20 μm.
Figure 6
Figure 6. PMA-stimulated chromatin release by defence cells from other invertebrate species in vitro.
(ad) Unfixed M. edulis haemocytes in monolayer culture (24–48 h at 10 °C), stained with Sytox Green. (a) 0.1 μM PMA, 24 h. (b) 25 μM PMA, 48 h. (c) 50 μM PMA, 48 h. (ac) Scale bars, 300 μm. (d) Percentage of ETotic M. edulis haemocytes following PMA treatment (25 or 50 μM, 48 h), 50 μM PMA +/− 10 μM DPI or untreated (Cont.). Values means±s.e.m., n=3. Significant differences between PMA and untreated haemocytes denoted by a. Significant differences between PMA and PMA +/− DPI denoted by b. In both cases, P<0.05, one-way analysis of variance (ANOVA) with Student–Newman–Keuls (SNK) post hoc test. (eg) Chromatin release by mesogleal cells isolated from A. equina (24 h, 0.1 μM PMA, 10 °C). (e) Crude cell extract. (f) Merge of e with same phase contrast image. Arrows indicate cnidocytes. (e,f) Scale bars, 33 μm (g) Phagocyte-enriched mesogleal extract after trypsin digestion and differential centrifugation. Scale bar, 65 μm. (h) Percentage of ETotic cells enriched from the mesoglea of A. equina following treatment with PMA (24 h, 0.1 μM), PMA+2 μM DPI, PMA+10 μM cytochalasin D (Cyt-D) or left untreated (Cont.). Values are mean±s.e.m., n=3. Significant differences between PMA and untreated cells are denoted by a. Significant differences between PMA, and PMA+DPI or PMA+Cyt-D are denoted by b. In both cases P<0.05, one-way ANOVA with SNK post hoc test.

References

    1. Brinkmann V. et al.. Neutrophil extracellular traps kill bacteria. Science 303, 1532–1535 (2004). - PubMed
    1. von Kockritz-Blickwede M. et al.. Phagocytosis independent antimicrobial activity of mast cells by means of extracellular trap formation. Blood 111, 3070–3080 (2008). - PubMed
    1. Yousefi S. et al.. Catapult-like release of mitochondrial DNA by eosinophils contributes to antibacterial defense. Nat. Med. 14, 949–953 (2008). - PubMed
    1. Webster S. J. et al.. Distinct cell death programs in monocytes regulate innate responses following challenge with common causes of invasive bacterial disease. J. Immunol. 185, 2968–2979 (2010). - PMC - PubMed
    1. Aulik N. A., Hellenbrand K. M. & Czuprynski C. J. Mannheimia haemolytica and its leukotoxin causes macrophage extracellular trap 2 (MET) formation by bovine macrophages. Infect. Immun. 80, 1923–1933 (2012). - PMC - PubMed

Publication types