

EEG source connectivity analysis: from dense array recordings to brain networks
- PMID: 25115932
- PMCID: PMC4130623
- DOI: 10.1371/journal.pone.0105041
EEG source connectivity analysis: from dense array recordings to brain networks
Abstract
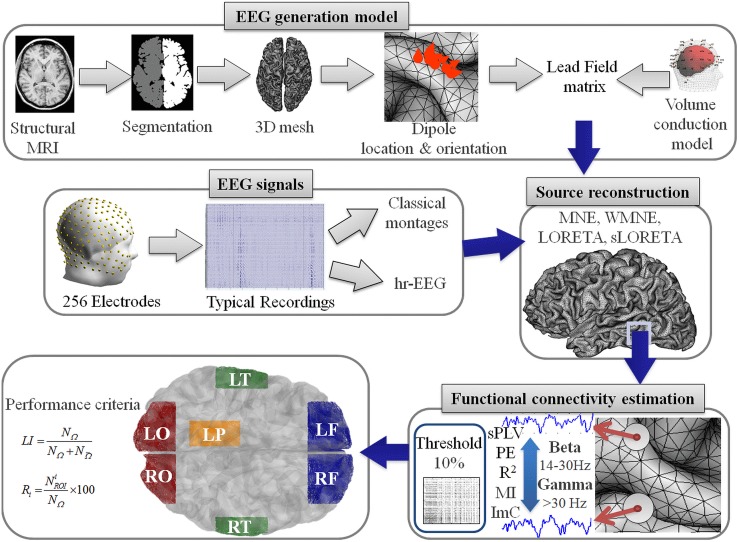
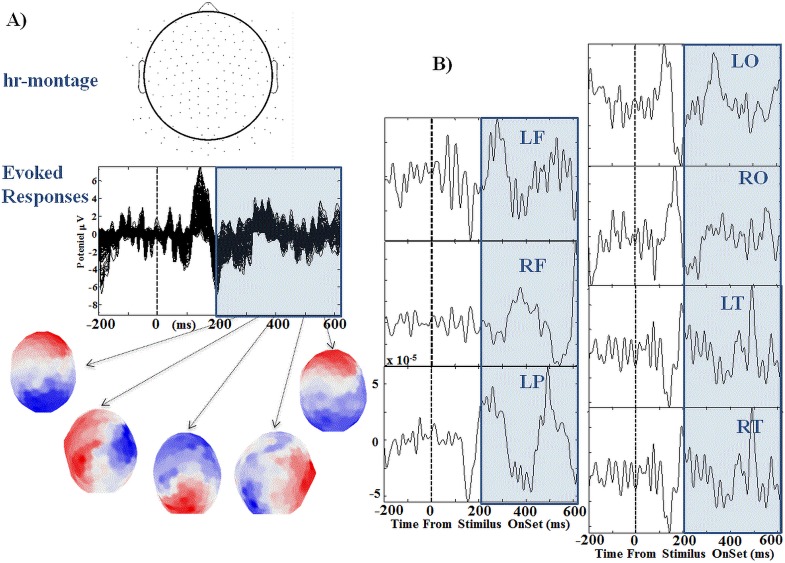
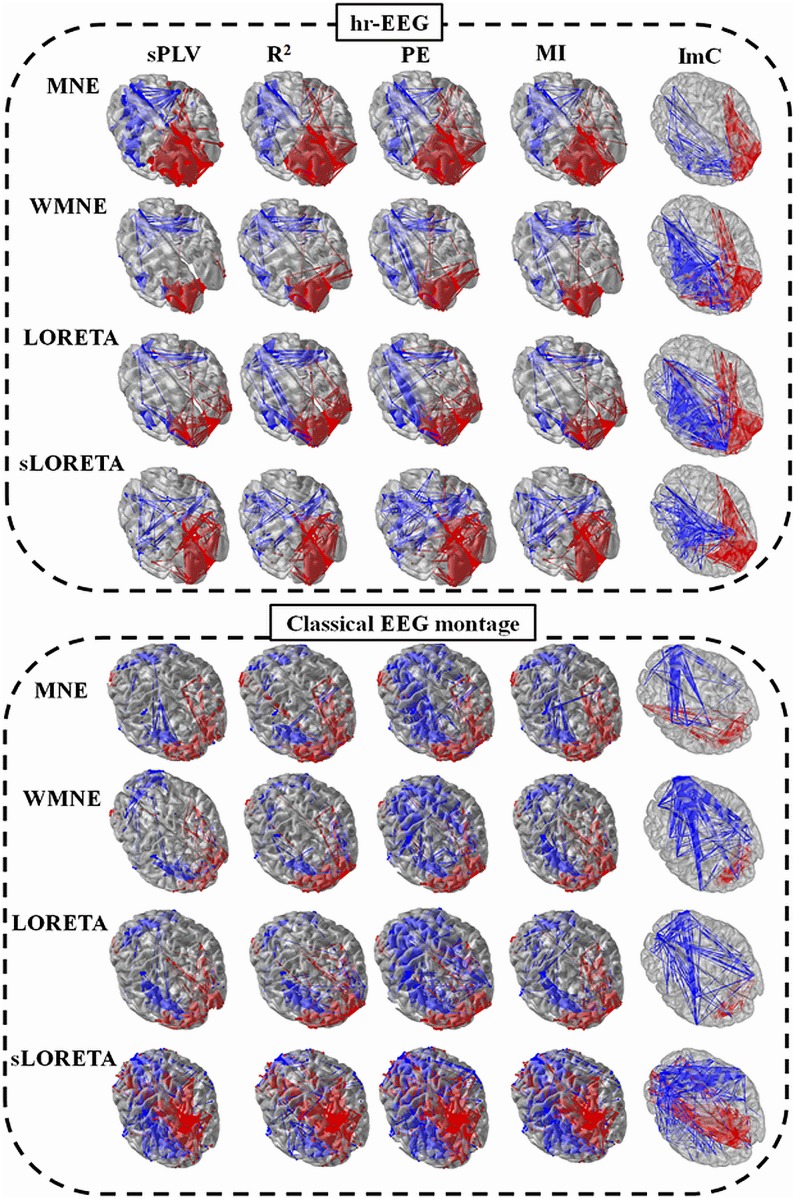
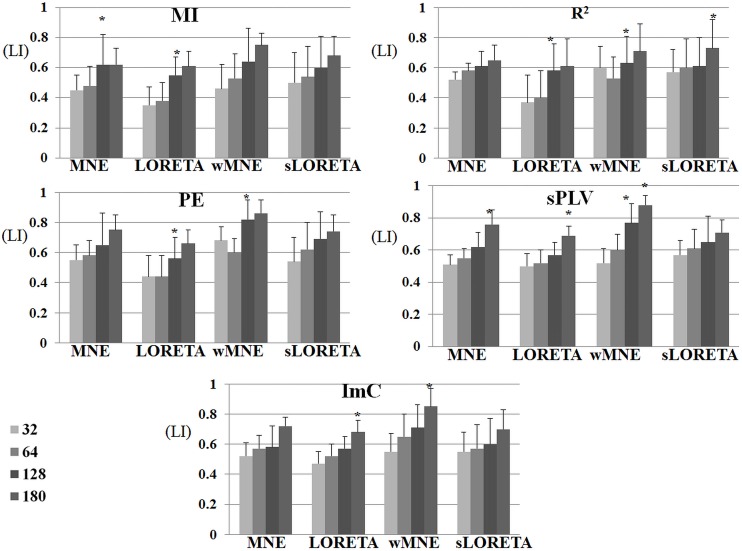
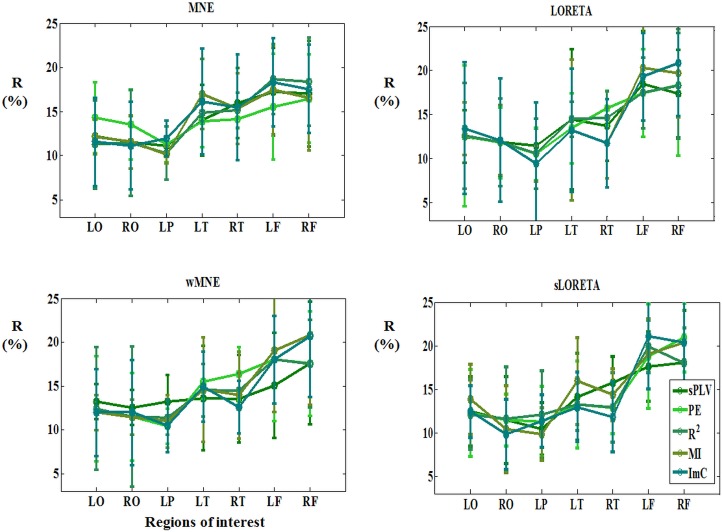
The recent past years have seen a noticeable increase of interest for electroencephalography (EEG) to analyze functional connectivity through brain sources reconstructed from scalp signals. Although considerable advances have been done both on the recording and analysis of EEG signals, a number of methodological questions are still open regarding the optimal way to process the data in order to identify brain networks. In this paper, we analyze the impact of three factors that intervene in this processing: i) the number of scalp electrodes, ii) the combination between the algorithm used to solve the EEG inverse problem and the algorithm used to measure the functional connectivity and iii) the frequency bands retained to estimate the functional connectivity among neocortical sources. Using High-Resolution (hr) EEG recordings in healthy volunteers, we evaluated these factors on evoked responses during picture recognition and naming task. The main reason for selection this task is that a solid literature background is available about involved brain networks (ground truth). From this a priori information, we propose a performance criterion based on the number of connections identified in the regions of interest (ROI) that belong to potentially activated networks. Our results show that the three studied factors have a dramatic impact on the final result (the identified network in the source space) as strong discrepancies were evidenced depending on the methods used. They also suggest that the combination of weighted Minimum Norm Estimator (wMNE) and the Phase Synchronization (PS) methods applied on High-Resolution EEG in beta/gamma bands provides the best performance in term of topological distance between the identified network and the expected network in the above-mentioned cognitive task.
Conflict of interest statement
Figures
References
-
- Stevens MC (2009) The developmental cognitive neuroscience of functional connectivity. Brain and cognition 70: 1–12. - PubMed
-
- Uhlhaas PJ, Singer W (2006) Neural synchrony in brain disorders: relevance for cognitive dysfunctions and pathophysiology. Neuron 52: 155–168. - PubMed
-
- David O, Cosmelli D, Hasboun D, Garnero L (2003) A multitrial analysis for revealing significant corticocortical networks in magnetoencephalography and electroencephalography. Neuroimage 20: 186–201. - PubMed
Publication types
MeSH terms
LinkOut - more resources
Full Text Sources
Other Literature Sources
Medical
Miscellaneous
