. 2014 Nov 1:274:334-43.
doi: 10.1016/j.bbr.2014.08.004. Epub 2014 Aug 10.

Gait analysis and the cumulative gait index (CGI): Translational tools to assess impairments exhibited by rats with olivocerebellar ataxia

Affiliations

Gait analysis and the cumulative gait index (CGI): Translational tools to assess impairments exhibited by rats with olivocerebellar ataxia

C S Lambert et al. Behav Brain Res. .

Abstract

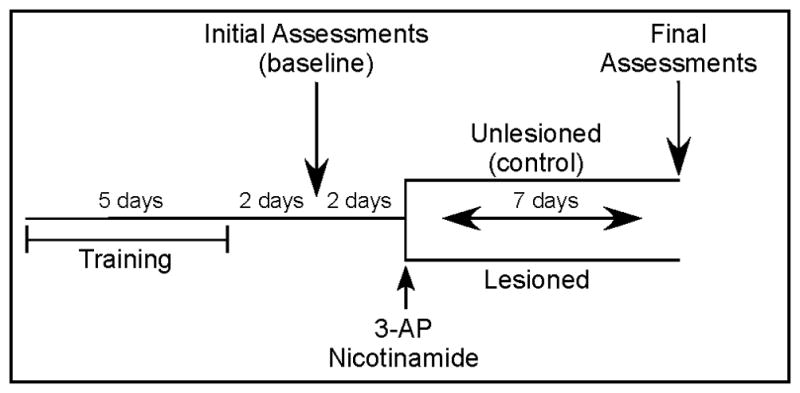
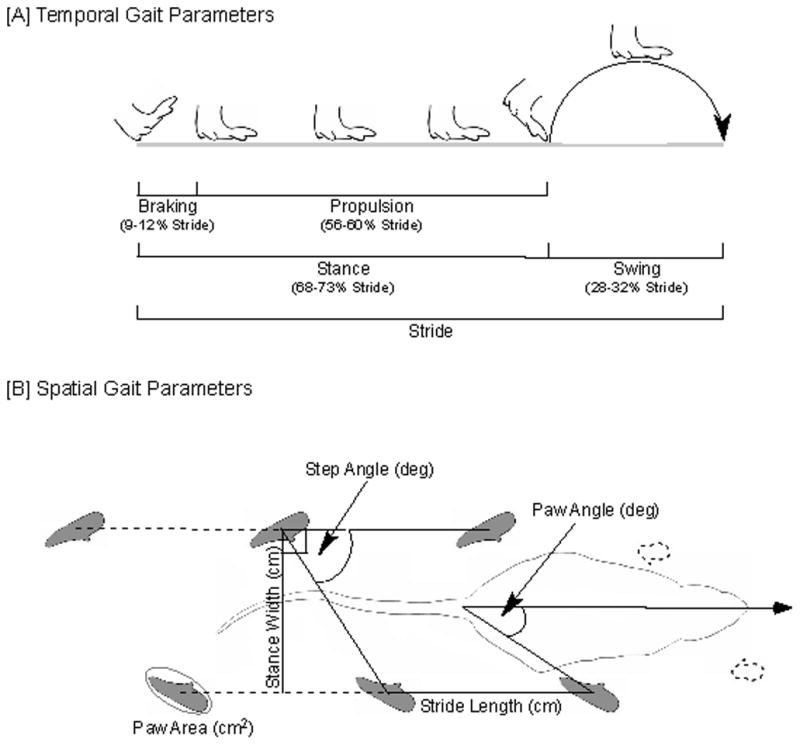
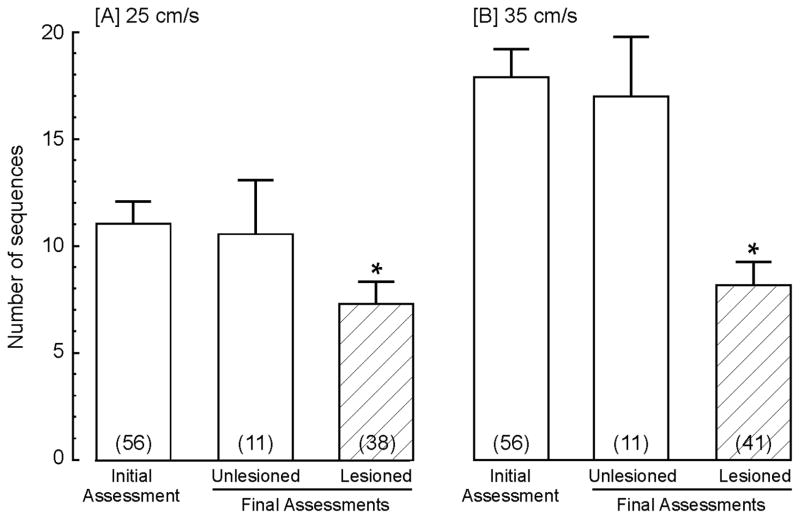
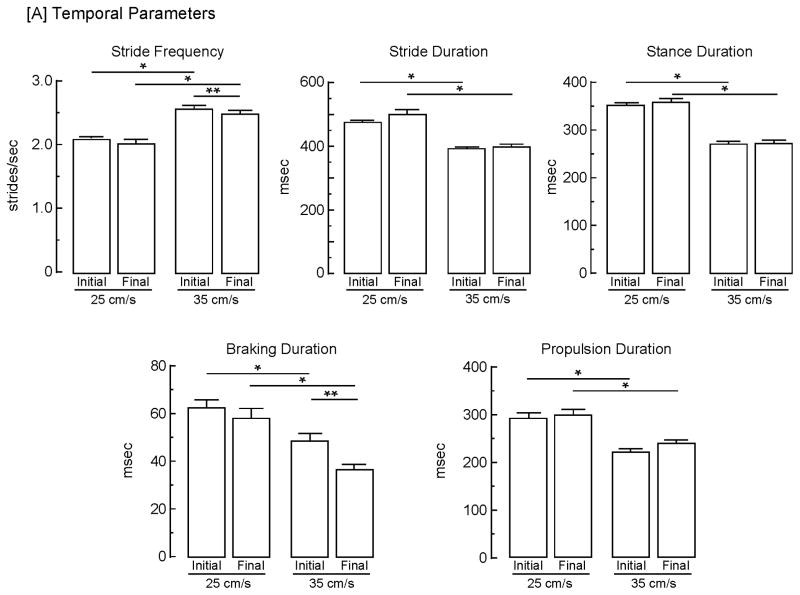
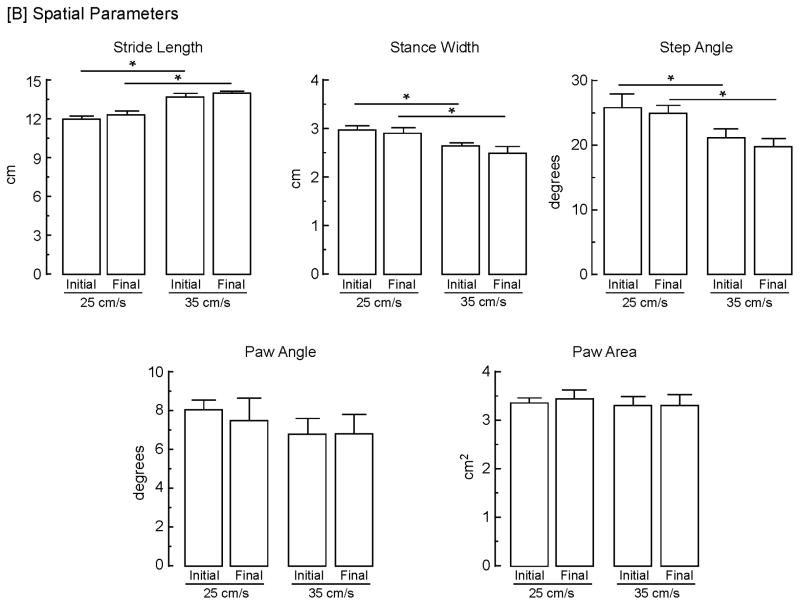
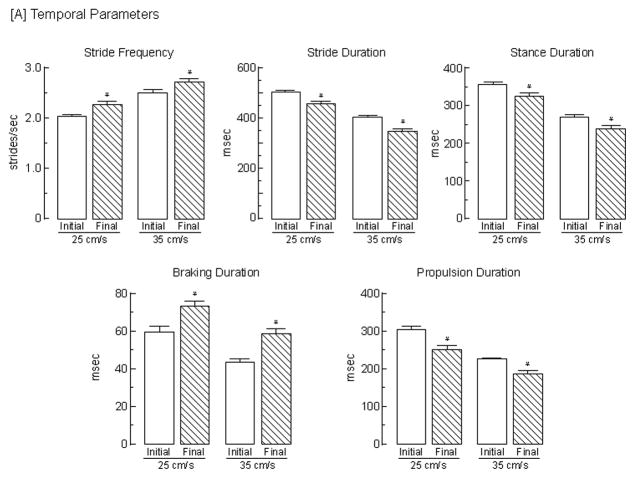
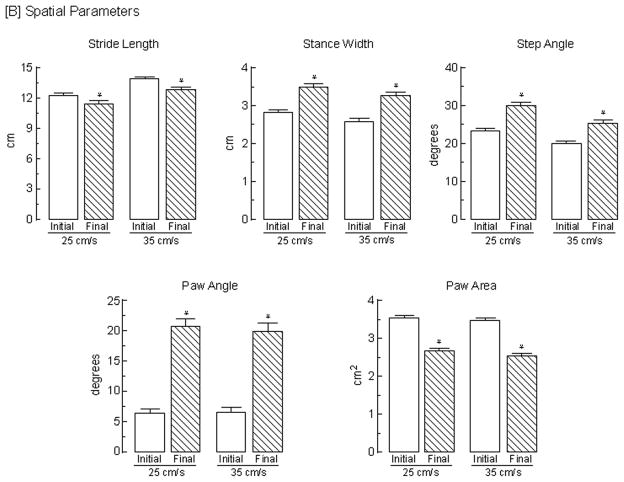
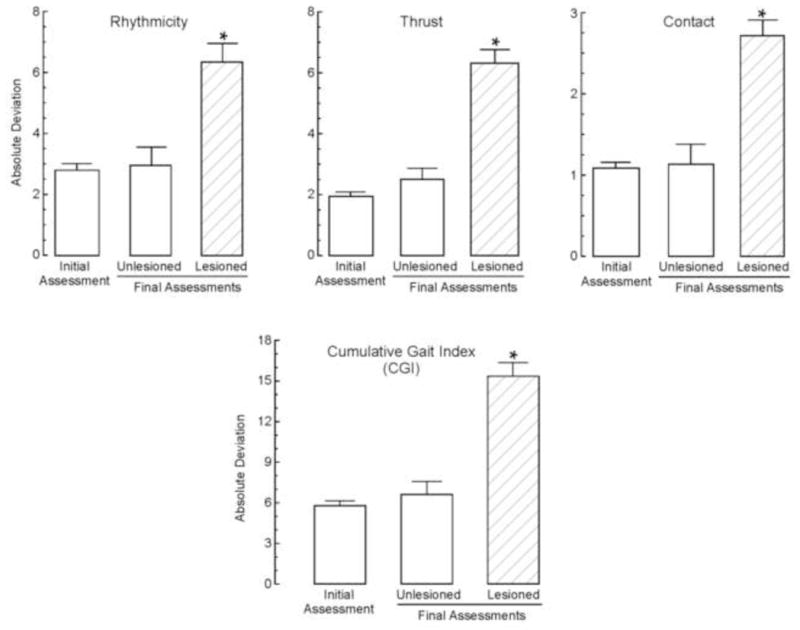
Deviations from 'normal' locomotion exhibited by humans and laboratory animals may be determined using automated systems that capture both temporal and spatial gait parameters. Although many measures generated by these systems are unrelated and independent, some may be related and dependent, representing redundant assessments of function. To investigate this possibility, a treadmill-based system was used to capture gait parameters from normal and ataxic rats, and a multivariate analysis was conducted to determine deviations from normal. Rats were trained on the treadmill at two speeds, and gait parameters were generated prior to and following lesions of the olivocerebellar pathway. Control (non-lesioned) animals exhibited stable hindlimb gait parameters across assessments at each speed. Lesioned animals exhibited alterations in multiple hindlimb gait parameters, characterized by significant increases in stride frequency, braking duration, stance width, step angle, and paw angle and decreases in stride, stance, swing and propulsion durations, stride length and paw area. A principal component analysis of initial hindlimb measures indicated three uncorrelated factors mediating performance, termed Rhythmicity, Thrust and Contact. Deviation in the performance of each animal from the group mean was determined for each factor and values summed to yield the cumulative gait index (CGI), a single value reflecting variation within the group. The CGI for lesioned animals increased 2.3-fold relative to unlesioned animals. This study characterizes gait alterations in laboratory rats rendered ataxic by destruction of the climbing fiber pathway innervating Purkinje cells and demonstrates that a single index can be used to describe overall gait impairments.

Keywords: Ataxia; DigiGait™ Imaging System; Olivocerebellar-lesioned rat; Treadmill gait analysis.


Figures

Fig. 1
Fig. 1
Experimental paradigm. Rats were trained to walk on the DigiGait system at 25 and 35 cm/s for 5 consecutive days. Initial behavioral assessments were conducted 2 days following training by recording baseline performance for 2 minutes at both speeds. At 2 days following initial recordings, animals were assigned randomly to either unlesioned (control) or lesioned groups, and the latter received injections of 3-AP/nicotinamide. All animals were reassessed 7 days later for 2 minutes at both speeds.
Fig. 2
Fig. 2
Representation of gait parameters. Diagrammatic representation of temporal and spatial gait parameters analyzed.
Fig. 3
Fig. 3
Effects of olivocerebellar lesions on treadmill performance. The number of uninterrupted sequences containing 6–11 strides within a 2 minute segment at treadmill speeds of [A] 25 cm/s and [B] 35 cm/s were determined at baseline (initial assessment) and 9 days later (final assessment) for both unlesioned and 3-AP lesioned animals. Bars represent mean values + s.e.m.; the number of animals per group is shown in parentheses. The asterisks denote significant (p < 0.05) differences.
Fig. 4
Fig. 4
Stability of gait measures and effects of treadmill speed. Both [A] temporal and [B] spatial gait parameters were determined from a representative stride sequence exhibited by control (unlesioned) animals at treadmill speeds of both 25 and 35 cm/s at 2 days following training and 9 days later. Bars represent mean values + s.e.m. of determinations from 11 animals. Data were analyzed using a 2 × 2 (speed x assessment timepoint) repeated measures ANOVA with t-tests post hoc to assess differences. The asterisks indicate significant (p < 0.05) differences between speeds for: stride frequency, initial [t (20) = 5.97] and final [t (20) = 5.97]; stride duration, initial [t (20) = 6.02] and final [t (20) = 5.84]; stance duration, initial [t (20) = 8.28] and final [t (20) = 6.99]; braking duration, initial [t (20) = 2.23] and final [t (20) = 3.06]; propulsion duration, initial [t (20) = 5.34] and final [t (20) = 5.20]; stride length, initial [t (20) = 5.58] and final [t (20) = 4.29]; and step angle, final [t (20) = 2.56]. The double asterisks indicate significant (p < 0.05) differences between assessments for stride frequency [t (10) = 2.25] and braking duration [t (10) = 2.52].
Fig. 4
Fig. 4
Stability of gait measures and effects of treadmill speed. Both [A] temporal and [B] spatial gait parameters were determined from a representative stride sequence exhibited by control (unlesioned) animals at treadmill speeds of both 25 and 35 cm/s at 2 days following training and 9 days later. Bars represent mean values + s.e.m. of determinations from 11 animals. Data were analyzed using a 2 × 2 (speed x assessment timepoint) repeated measures ANOVA with t-tests post hoc to assess differences. The asterisks indicate significant (p < 0.05) differences between speeds for: stride frequency, initial [t (20) = 5.97] and final [t (20) = 5.97]; stride duration, initial [t (20) = 6.02] and final [t (20) = 5.84]; stance duration, initial [t (20) = 8.28] and final [t (20) = 6.99]; braking duration, initial [t (20) = 2.23] and final [t (20) = 3.06]; propulsion duration, initial [t (20) = 5.34] and final [t (20) = 5.20]; stride length, initial [t (20) = 5.58] and final [t (20) = 4.29]; and step angle, final [t (20) = 2.56]. The double asterisks indicate significant (p < 0.05) differences between assessments for stride frequency [t (10) = 2.25] and braking duration [t (10) = 2.52].
Fig. 5
Fig. 5
Effects of 3-AP on gait parameters. Both [A] temporal and [B] spatial gait parameters were determined from a representative stride sequence exhibited by animals 2 days prior to (initial) and 7 days following (final) the induction of an olivocerebellar lesion by the administration of 3-AP; parameters were determined at treadmill speeds of both 25 and 35 cm/s. Bars represent mean values + s.e.m. of determinations from 45 animals. Data were analyzed using a 2 × 2 (speed x assessment timepoint) repeated measures ANOVA with t-tests post hoc to assess differences. The asterisks indicate significant (p < 0.05) differences between initial (pre-lesion) and final (post-lesion) assessments for: stride frequency, 25 cm/s [t (44) = 3.77] and 35 cm/s [t (44) = 5.73]; stride duration, 25 cm/s [t (44) = 3.53] and 35 cm/s [t (44) = 6.82]; stance duration, 25 cm/s [t (44) = 4.37] and 35 cm/s [t (44) = 7.68]; braking duration, 25 cm/s [t (44) = 3.86] and 35 cm/s [t (44) = 5.32]; propulsion duration, 25 cm/s [t (44) = 5.37] and 35 cm/s [t (44) = 11.0]; stride length, 25 cm/s [t (44) = 3.47] and 35 cm/s [t (44) = 6.80]; stance width, 25 cm/s [t (44) = 8.87] and 35 cm/s [t (44) = 7.08]; step angle, 25 cm/s [t (44) = 4.18 ] and 35 cm/s [t (44) = 3.71]; paw angle, 25 cm/s [t (44) = 11.7] and 35 cm/s [t (44) = 11.3]; and paw area, 25 cm/s [t (44) = 9.83] and 35 cm/s [t (44) = 10.7].
Fig. 5
Fig. 5
Effects of 3-AP on gait parameters. Both [A] temporal and [B] spatial gait parameters were determined from a representative stride sequence exhibited by animals 2 days prior to (initial) and 7 days following (final) the induction of an olivocerebellar lesion by the administration of 3-AP; parameters were determined at treadmill speeds of both 25 and 35 cm/s. Bars represent mean values + s.e.m. of determinations from 45 animals. Data were analyzed using a 2 × 2 (speed x assessment timepoint) repeated measures ANOVA with t-tests post hoc to assess differences. The asterisks indicate significant (p < 0.05) differences between initial (pre-lesion) and final (post-lesion) assessments for: stride frequency, 25 cm/s [t (44) = 3.77] and 35 cm/s [t (44) = 5.73]; stride duration, 25 cm/s [t (44) = 3.53] and 35 cm/s [t (44) = 6.82]; stance duration, 25 cm/s [t (44) = 4.37] and 35 cm/s [t (44) = 7.68]; braking duration, 25 cm/s [t (44) = 3.86] and 35 cm/s [t (44) = 5.32]; propulsion duration, 25 cm/s [t (44) = 5.37] and 35 cm/s [t (44) = 11.0]; stride length, 25 cm/s [t (44) = 3.47] and 35 cm/s [t (44) = 6.80]; stance width, 25 cm/s [t (44) = 8.87] and 35 cm/s [t (44) = 7.08]; step angle, 25 cm/s [t (44) = 4.18 ] and 35 cm/s [t (44) = 3.71]; paw angle, 25 cm/s [t (44) = 11.7] and 35 cm/s [t (44) = 11.3]; and paw area, 25 cm/s [t (44) = 9.83] and 35 cm/s [t (44) = 10.7].
Fig. 6
Fig. 6
Resultant PCA factors and the cumulative gait index. The 3 factors generated by the PCA (Rhythmicity, Thrust and Contact) and the CGI were analyzed across timepoints. Bars represent mean values + s.e.m. with an n=56 for initial assessments representing the total population, n=11 for the unlesioned group and n=45 for the lesioned group. Data were compared using a one-way ANOVA. The asterisks denote significant (p<0.05) differences from all other groups as determined by Tukey’s test.

References

    1. de Medinaceli L, Freed WJ, Wyatt RJ. An index of the functional condition of rat sciatic nerve based on measurements made from walking tracks. Exp Neurol. 1982;77:634–43. - PubMed
    1. Mullenix P, Norton S, Culver B. Locomotor damage in rats after x-irradiation in utero. Exp Neurol. 1975;48:310–24. - PubMed
    1. Clarke KA, Parker AJ. A quantitative study of normal locomotion in the rat. Physiol Behav. 1986;38:345–51. - PubMed
    1. Tang W, Su D. Locomotion analysis and its applications in neurological disorders detection: state-of-art review. Network Modeling Analysis in Health Informatics and Bioinformatics. 2013;2:1–12.
    1. Duvick L, Barnes J, Ebner B, Agrawal S, Andresen M, Lim J, et al. SCA1-like disease in mice expressing wild-type ataxin-1 with a serine to aspartic acid replacement at residue 776. Neuron. 2010;67:929–35. - PMC - PubMed

Publication types