. 2014 Aug 13:4:6055.
doi: 10.1038/srep06055.

Genome-wide genotype and sequence-based reconstruction of the 140,000 year history of modern human ancestry

Affiliations

Genome-wide genotype and sequence-based reconstruction of the 140,000 year history of modern human ancestry

Daniel Shriner et al. Sci Rep. .

Abstract

We investigated ancestry of 3,528 modern humans from 163 samples. We identified 19 ancestral components, with 94.4% of individuals showing mixed ancestry. After using whole genome sequences to correct for ascertainment biases in genome-wide genotype data, we dated the oldest divergence event to 140,000 years ago. We detected an Out-of-Africa migration 100,000-87,000 years ago, leading to peoples of the Americas, east and north Asia, and Oceania, followed by another migration 61,000-44,000 years ago, leading to peoples of the Caucasus, Europe, the Middle East, and south Asia. We dated eight divergence events to 33,000-20,000 years ago, coincident with the Last Glacial Maximum. We refined understanding of the ancestry of several ethno-linguistic groups, including African Americans, Ethiopians, the Kalash, Latin Americans, Mozabites, Pygmies, and Uygurs, as well as the CEU sample. Ubiquity of mixed ancestry emphasizes the importance of accounting for ancestry in history, forensics, and health.


Figures

Figure 1
Figure 1. Global distribution of samples.
Red represents Africa, orange represents the Americas, yellow represents Asia, black represents the Caucasus, green represents Europe, blue represents the Middle East, and violet represents Oceania. The map was drawn using the R library maps.
Figure 2
Figure 2. Ancestry analysis of the global data set.
The 163 samples are labeled in the left margin, the numbers of ancestral components are labeled in the top margin, and the geographical sample origins are labeled in the right margin. In the plot with 19 ancestral components, the ancestral components from top to bottom are Pygmy (magenta), Click Speaker (green), Niger-Congo (red), Nilo-Saharan (yellow), Lowland East Cushitic (turquoise), Omotic (coral), Berber (dark goldenrod), Kalash (white), Indian (orange), Siberian (slate blue), Japanese (blue), Chinese (dark orchid), Southeast Asian (brown), Melanesian (pink), Native American (purple), Levantine-Caucasian (dark olive green), Arabian (gray), Southern European (black), and Northern European (aquamarine).
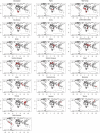
Figure 3
Figure 3. Global distribution of the ancestral components.
Each sample is represented by a circle. The intensity of the red color is directly proportional to the percentage for the ancestral component in the sample. Maps were drawn using the R library maps.
Figure 4
Figure 4. Dendrogram of ancestral components by FST.
The plot was drawn using hierarchical cluster analysis with complete linkage.
Figure 5
Figure 5. Dendrogram of ancestral components by generations since divergence.
The plot was drawn using hierarchical cluster analysis with complete linkage.

References

    1. Li H. & Durbin R. Inference of human population history from individual whole-genome sequences. Nature 475, 493–496 (2011). - PMC - PubMed
    1. Gronau I., Hubisz M. J., Gulko B., Danko C. G. & Siepel A. Bayesian inference of ancient human demography from individual genome sequences. Nat. Genet. 43, 1031–1034 (2011). - PMC - PubMed
    1. Harris K. & Nielsen R. Inferring demographic history from a spectrum of shared haplotype lengths. PLoS Genet. 9, e1003521 (2013). - PMC - PubMed
    1. Gutenkunst R. N., Hernandez R. D., Williamson S. H. & Bustamante C. D. Inferring the joint demographic history of multiple populations from multidimensional SNP frequency data. PLoS Genet. 5, e1000695 (2009). - PMC - PubMed
    1. Li J. Z. et al. Worldwide human relationships inferred from genome-wide patterns of variation. Science 319, 1100–1104 (2008). - PubMed

Publication types

Substances

LinkOut - more resources