

Plasma DYRK1A as a novel risk factor for Alzheimer's disease
- PMID: 25116835
- PMCID: PMC4150238
- DOI: 10.1038/tp.2014.61
Plasma DYRK1A as a novel risk factor for Alzheimer's disease
Abstract
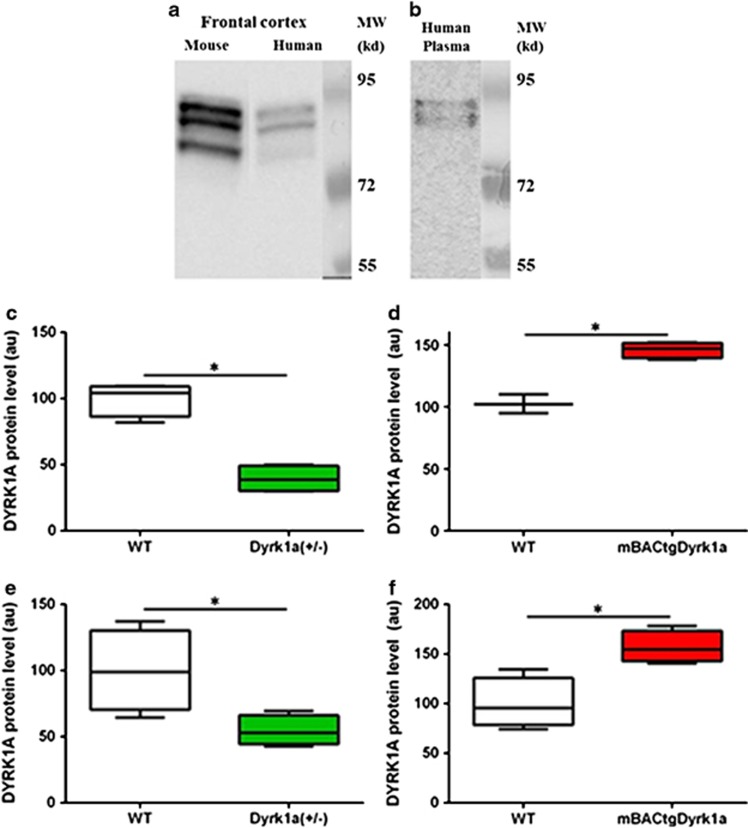
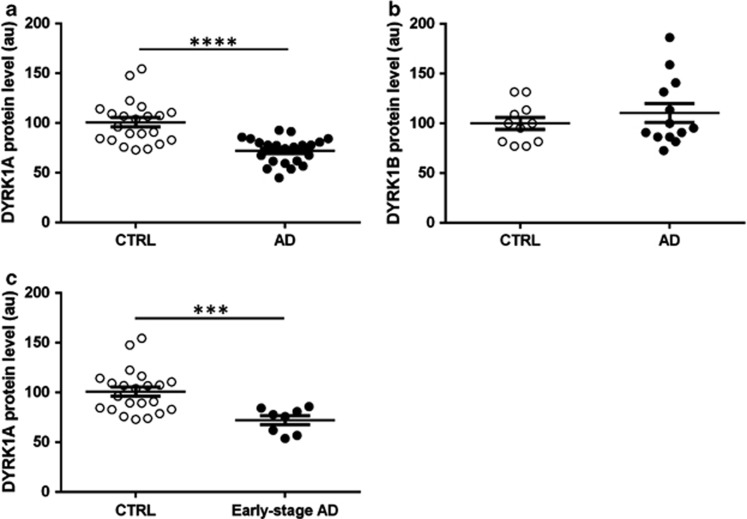
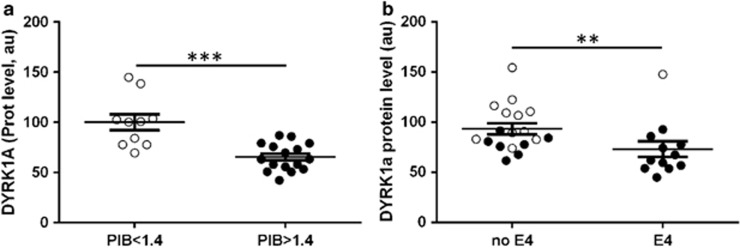
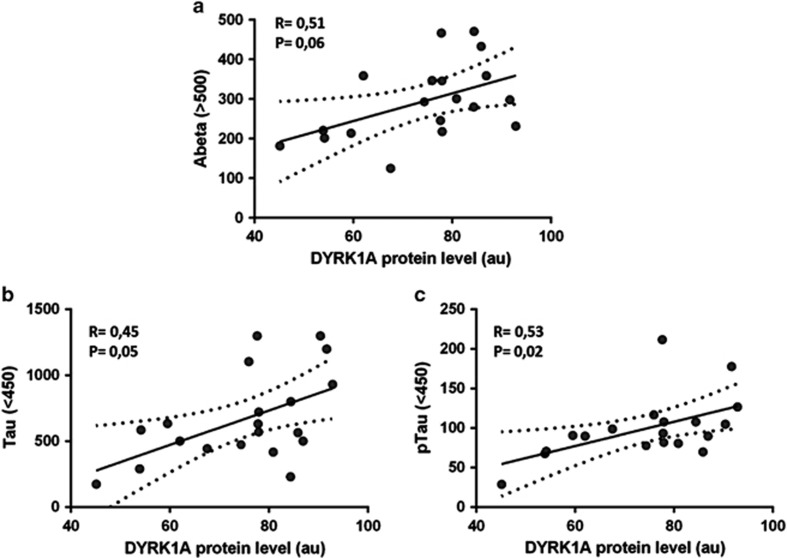
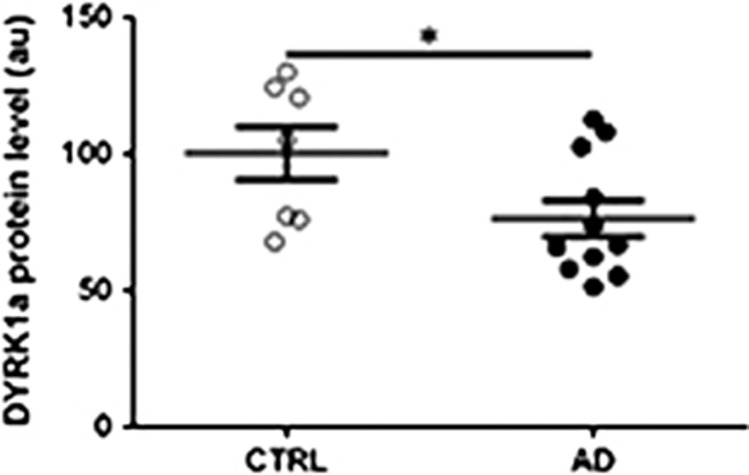
To determine whether apparent involvement of DYRK1A in Alzheimer's disease (AD) pathology makes it a candidate plasma biomarker for diagnosis, we developed a method to quantify plasma DYRK1A by immunoblot in transgenic mouse models having different gene dosages of Dyrk1a, and, consequently, different relative protein expression. Then, we measured plasma DYRK1A levels in 26 patients with biologically confirmed AD and 25 controls (negative amyloid imaging available on 13). DYRK1A was detected in transgenic mouse brain and plasma samples, and relative levels of DYRK1A correlated with the gene copy number. In plasma from AD patients, DYRK1A levels were significantly lower compared with controls (P<0.0001). Results were similar when we compared AD patients with the subgroup of controls confirmed by negative amyloid imaging. In a subgroup of patients with early AD (CDR=0.5), lower DYRK1A expression was confirmed. In contrast, no difference was found in levels of DYRK1B, the closest relative of DYRK1A, between AD patients and controls. Further, AD patients exhibited a positive correlation between plasma DYRK1A levels and cerebrospinal fluid tau and phosphorylated-tau proteins, but no correlation with amyloid-β42 levels and Pittsburgh compound B cortical binding. DYRK1A levels detected in lymphoblastoid cell lines from AD patients were also lower when compared with cells from age-matched controls. These findings suggest that reduced DYRK1A expression might be a novel plasma risk factor for AD.
Figures
Similar articles
-
Combined assessment of DYRK1A, BDNF and homocysteine levels as diagnostic marker for Alzheimer's disease.Transl Psychiatry. 2017 Jun 20;7(6):e1154. doi: 10.1038/tp.2017.123. Transl Psychiatry. 2017. PMID: 28632203 Free PMC article.
-
Normalizing the gene dosage of Dyrk1A in a mouse model of Down syndrome rescues several Alzheimer's disease phenotypes.Neurobiol Dis. 2017 Oct;106:76-88. doi: 10.1016/j.nbd.2017.06.010. Epub 2017 Jun 21. Neurobiol Dis. 2017. PMID: 28647555
-
Overexpression of miR-26a-5p Suppresses Tau Phosphorylation and Aβ Accumulation in the Alzheimer's Disease Mice by Targeting DYRK1A.Curr Neurovasc Res. 2020;17(3):241-248. doi: 10.2174/1567202617666200414142637. Curr Neurovasc Res. 2020. PMID: 32286945
-
[Elucidating Pathogenic Mechanisms of Early-onset Alzheimer's Disease in Down Syndrome Patients].Yakugaku Zasshi. 2017;137(7):801-805. doi: 10.1248/yakushi.16-00236-2. Yakugaku Zasshi. 2017. PMID: 28674290 Review. Japanese.
-
Core candidate neurochemical and imaging biomarkers of Alzheimer's disease.Alzheimers Dement. 2008 Jan;4(1):38-48. doi: 10.1016/j.jalz.2007.08.006. Epub 2007 Dec 21. Alzheimers Dement. 2008. PMID: 18631949 Review.
Cited by
-
Targeting CaN/NFAT in Alzheimer's brain degeneration.Front Immunol. 2023 Nov 23;14:1281882. doi: 10.3389/fimmu.2023.1281882. eCollection 2023. Front Immunol. 2023. PMID: 38077352 Free PMC article. Review.
-
Abnormalities of DYRK1A-Cytoskeleton Complexes in the Blood Cells as Potential Biomarkers of Alzheimer's Disease.J Alzheimers Dis. 2019;72(4):1059-1075. doi: 10.3233/JAD-190475. J Alzheimers Dis. 2019. PMID: 31683476 Free PMC article.
-
The Common Alzheimer's Disease Research Ontology (CADRO) for biomarker categorization.Alzheimers Dement (N Y). 2025 Feb 11;11(1):e70050. doi: 10.1002/trc2.70050. eCollection 2025 Jan-Mar. Alzheimers Dement (N Y). 2025. PMID: 39935614 Free PMC article. Review.
-
Blood-Based Kinase Assessments in Alzheimer's Disease.Front Aging Neurosci. 2018 Nov 14;10:338. doi: 10.3389/fnagi.2018.00338. eCollection 2018. Front Aging Neurosci. 2018. PMID: 30487744 Free PMC article. Review.
-
Over-expression of Dyrk1A affects bleeding by modulating plasma fibronectin and fibrinogen level in mice.J Cell Mol Med. 2023 Aug;27(15):2228-2238. doi: 10.1111/jcmm.17817. Epub 2023 Jul 6. J Cell Mol Med. 2023. PMID: 37415307 Free PMC article.
References
-
- Corbett A, Pickett J, Burns A, Corcoran J, Dunnett SB, Edison P, et al. Drug repositioning for Alzheimer's disease. Nat Rev Drug Discov. 2012;11:833–846. - PubMed
-
- Hansson O, Zetterberg H, Buchhave P, Londos E, Blennow K, Minthon L. Association between CSF biomarkers and incipient Alzheimer's disease in patients with mild cognitive impairment: a follow-up study. Lancet Neurol. 2006;5:228–234. - PubMed
-
- Ballard C, Gauthier S, Corbett A, Brayne C, Aarsland D, Jones E. Alzheimer's disease. Lancet. 2011;377:1019–1031. - PubMed
MeSH terms
Substances
LinkOut - more resources
Full Text Sources
Other Literature Sources
Medical
