. 2014 Aug 12:3:e01267.
doi: 10.7554/eLife.01267.

The transcription factor NRSF contributes to epileptogenesis by selective repression of a subset of target genes

Affiliations

The transcription factor NRSF contributes to epileptogenesis by selective repression of a subset of target genes

Shawn McClelland et al. Elife. .

Abstract

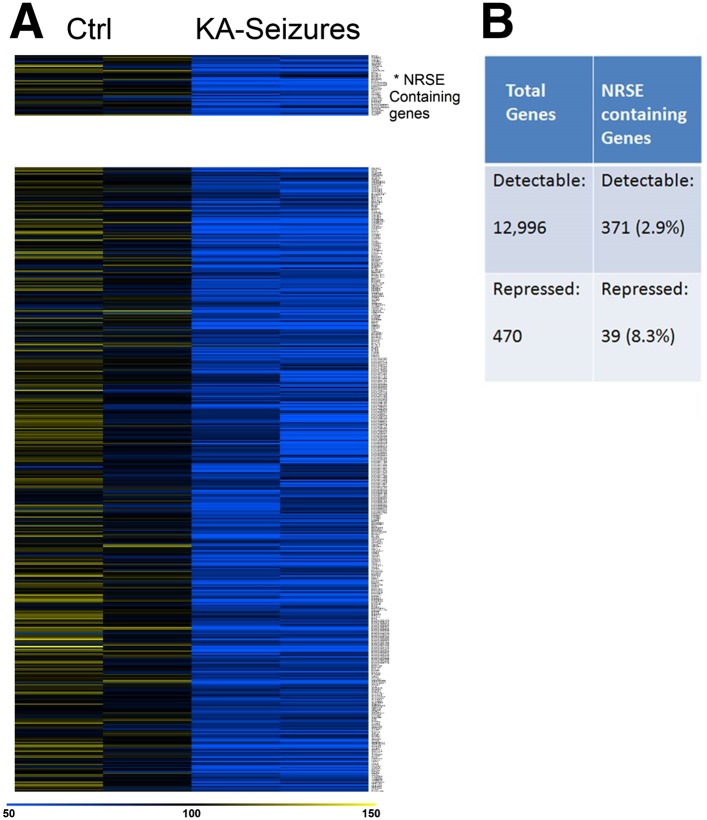
The mechanisms generating epileptic neuronal networks following insults such as severe seizures are unknown. We have previously shown that interfering with the function of the neuron-restrictive silencer factor (NRSF/REST), an important transcription factor that influences neuronal phenotype, attenuated development of this disorder. In this study, we found that epilepsy-provoking seizures increased the low NRSF levels in mature hippocampus several fold yet surprisingly, provoked repression of only a subset (∼10%) of potential NRSF target genes. Accordingly, the repressed gene-set was rescued when NRSF binding to chromatin was blocked. Unexpectedly, genes selectively repressed by NRSF had mid-range binding frequencies to the repressor, a property that rendered them sensitive to moderate fluctuations of NRSF levels. Genes selectively regulated by NRSF during epileptogenesis coded for ion channels, receptors, and other crucial contributors to neuronal function. Thus, dynamic, selective regulation of NRSF target genes may play a role in influencing neuronal properties in pathological and physiological contexts.

Keywords: epilepsy; gene set enrichment analysis; neuron-restrictive silencing factor.


Conflict of interest statement

The authors declare that no competing interests exist.

Figures

Figure 1.
Figure 1.. Kainic acid (KA)-seizure-induced increase of NRSF expression.
(A) Time-course of NRSF mRNA expression levels following KA-induced seizures, n = 4/group. (B) Representative western blot image of NRSF protein levels in control (ctrl) animals and animals at 72 hr and 1 week post KA-induced seizures. Quantification of NRSF protein levels using optical density measurements (ctrl 1.96 ± 0.18, n = 6; KA+72hr 6.75 ± 0.54, n = 3; KA+1 week: 5.42 ± 0.36, n = 3). (C and D) In situ hybridization and quantification of NRSF mRNA in organotypic hippocampal slice cultures which had undergone KA-induced seizure-like events. Quantification of mRNA in pyramidal cell layer was performed in control cultures as well as cultures 4 hr, 12 hr, 24 hr, and 1 week following seizure-like events in CA1 and CA3 region of the hippocampus, n = 4–8/group, *p<0.05. DOI: http://dx.doi.org/10.7554/eLife.01267.003
Figure 2.
Figure 2.. NRSE-containing genes are enriched among hippocampal genes repressed after network activity.
(A) Heat map representing genes with repressed mRNA expression levels in two representative samples from hippocampi derived from control (Ctrl) and from hippocampi from KA-seizures-experiencing rats. Expression levels are represented by color using a scale from 50% to 150% of expression, where yellow is the highest and blue is the lowest. (B) Relative abundance of NRSF target genes among total detected genes vs those repressed by KA-seizures. DOI: http://dx.doi.org/10.7554/eLife.01267.004
Figure 3.
Figure 3.. Abrogation of NRSF binding to target genes rescues the majority of NRSE-containing genes repressed by KA-seizures.
(A) A schematic illustrating the mechanism of action of NRSF following a seizure-induced increase and the decoy oligodeoxynucleotide (ODN) intervention strategy with the expected outcome. (B) A heat map representation of the changes in mRNA expression levels of genes that contain a putative NRSE site that were down-regulated 48 hr after KA-induced seizures. Heat map compares representative samples from two hippocampi, from each of four experimental conditions: 'controls' receiving random ODNs (n = 4); ‘controls’ receiving NRSE ODNs (n = 4); ‘KA-seizures’, rats sustaining KA induced seizure activity and receiving random ODNs (n = 3); ‘KA-seizures + NRSE-ODN’, rats sustaining KA-induced seizure activity and receiving NRSE-ODNs (n = 4). Samples and genes are plotted using hierarchical clustering using Euclidean distance and average linkage. Expression level is depicted by color using a scale from 50% to 150% of expression, where yellow is the highest and blue is the lowest. (C) Independent analysis of gene expression using qPCR. Several genes that were both repressed by seizure activity and rescued by interference with NRSF function were tested (Glra2, Myo5B, Stmn2), and results analyzed using two way ANOVA. Myo5B F(1,18) = 9.35, p = 0.007; Glra2 F(1,17) = 46.89, p = 0.0001; Stmn2 F(1,18) = 1.97, p = 0.047, n = 4/group. DOI: http://dx.doi.org/10.7554/eLife.01267.005
Figure 4.
Figure 4.. qPCR validation of microarray results.
(A) A selection of NRSE containing genes (Atp2b, Crhr2, Ep300, Hcn2, Kcnh2, P2xr5, Pcsk1, Xpo6) whose expression was unchanged according to the microarray following KA-seizures were measured using qPCR to validate the microarray n = 4/group. (B) qPCR measurement of a selection of the NRSE containing genes (Calb1, Glra2, Grin2a, Hcn1, Kcnc2, Klf9, Lrp11, Myo5b, Stmn2) whose expression was down-regulated following KA-seizures and rescued by NRSE-ODNs n = 4/group, p*<0.05. DOI: http://dx.doi.org/10.7554/eLife.01267.006
Figure 5.
Figure 5.. Physical binding of NRSF co-varies with tissue levels specifically at genes that are regulated by the repressor.
(A) NRSF binding (expressed as percent of input) to selected NRSE-containing genes in naive hippocampus with genes whose expression is repressed by seizure-induced NRSF increase represented in green, genes where NRSF occupancy was low are depicted in white, while genes where NRSF binding was abundant are depicted in black. (B) NRSF occupancy (percent input) at the same gene set in the hippocampus 48 hr following KA-induced seizures. (C) Graphical depiction of the changes (Delta) in NRSF occupancy at NRSE-containing gene sets comparing occupancy following KA-induced seizures to occupancy in the naive state. Genes whose expression was repressed are represented in green, n = 4–6/group, p*<0.05. DOI: http://dx.doi.org/10.7554/eLife.01267.007
Figure 6.
Figure 6.. A potential ‘dynamic range’ of repressor binding might enable gene regulation by moderate fluctuations of NRSF levels.
A graphical representation of our proposed hypothesis based on our observations that only a subset of NRSE-containing genes are functionally repressed by seizure-induced increases in NRSF levels and that these genes appear to have moderate NRSF binding in the naive brain. DOI: http://dx.doi.org/10.7554/eLife.01267.008
Figure 7.
Figure 7.. Genes regulated by seizure-dependent changes in NRSF function possess a distinct range of NRSF binding frequencies.
(A) Diagram illustrating sets of genes that were binned according to binding frequency based on Johnson et al., 2007. Gene sets were numbered in increasing order of their NRSF binding frequencies. Mid-range NRSF-binding frequencies are in green. (B and C) A binding frequency metric was established for each NRSF-binding gene based on the number of ChIP-Seq reads from published data (Johnson et al., 2007). The distribution of (B) all microarray-detectable NRSF-binding genes was compared to the distribution of (C) genes regulated by seizure-dependent NRSF changes, that is, those genes significantly repressed by network hyperactivity and rescued by NRSE–ODN treatment. Presented are scatter dot plots, with median with interquartile ranges. Below them are regression fit histogram plots. (D) Comparing microarray data from control rats to that of rats experiencing KA-seizures (both with scrambled ODN), using GSEA, illustrates that three gene-sets were significantly enriched in the control rats (repressed in the seizure + scrambled-ODN rats) and these fell in the mid-frequency category (see Table 1 for numeric values). DOI: http://dx.doi.org/10.7554/eLife.01267.009
Figure 8.
Figure 8.. Gene set enrichment analysis (GSEA, Broad Institute, MIT) curves of hippocampal NRSE-containing genes.
These genes have been classified (‘binned’) into eight groups by increasing order of their NRSF binding frequency rank percentile. Hence, these genes might be categorized as low-binding frequency (AC), mid-binding frequency (DF), and high-binding frequency (GH). Each graph shows enrichment plots comparing gene expression in KA-seizures vs controls in the presence of random ODNs. Please see Table 1, top, for the numeric values and parameters of the analyses. DOI: http://dx.doi.org/10.7554/eLife.01267.010

Similar articles

Cited by

References

    1. Abrajano JJ, Qureshi IA, Gokhan S, Zheng D, Bergman A, Mehler MF. 2009. Differential deployment of REST and CoREST promotes glial subtype specification and oligodendrocyte lineage maturation. PLOS ONE 4:e7665. doi: 10.1371/journal.pone.0007665 - DOI - PMC - PubMed
    1. Akhtar S, Kole R, Juliano RL. 1991. Stability of antisense DNA oligodeoxynucleotide analogs in cellular extracts and sera. Life Sciences 49:1793–1801. doi: 10.1016/0024-3205(91)90480-Y - DOI - PubMed
    1. Andres ME, Burger C, Peral-Rubio MJ, Battaglioli E, Anderson ME, Grimes J, Dallman J, Ballas N, Mandel G. 1999. CoREST: a functional corepressor required for regulation of neural specific gene expression. Proceedings of the National Academy of Sciences of USA 96:9873–9878. doi: 10.1073/pnas.96.17.9873 - DOI - PMC - PubMed
    1. Aoki H, Hara A, Era T, Kunisada T, Yamada Y. 2012. Genetic ablation of Rest leads to in vitro-specific derepression of neuronal genes during neurogenesis. Development 139:667–677. doi: 10.1242/dev.072272 - DOI - PubMed
    1. Bale TL, Baram TZ, Brown AS, Goldstein JM, Insel TR, McCarthy MM, Nemeroff CB, Reyes TM, Simerly RB, Susser ES, Nestler EJ. 2010. Early life programming and neurodevelopmental disorders. Biological Psychiatry 68:314–319. doi: 10.1016/j.biopsych.2010.05.028 - DOI - PMC - PubMed

Publication types

MeSH terms