. 2014 Aug 11;30(3):295-308.
doi: 10.1016/j.devcel.2014.06.005.

Integrin αvβ3 drives slug activation and stemness in the pregnant and neoplastic mammary gland

Affiliations

Integrin αvβ3 drives slug activation and stemness in the pregnant and neoplastic mammary gland

Jay S Desgrosellier et al. Dev Cell. .

Abstract

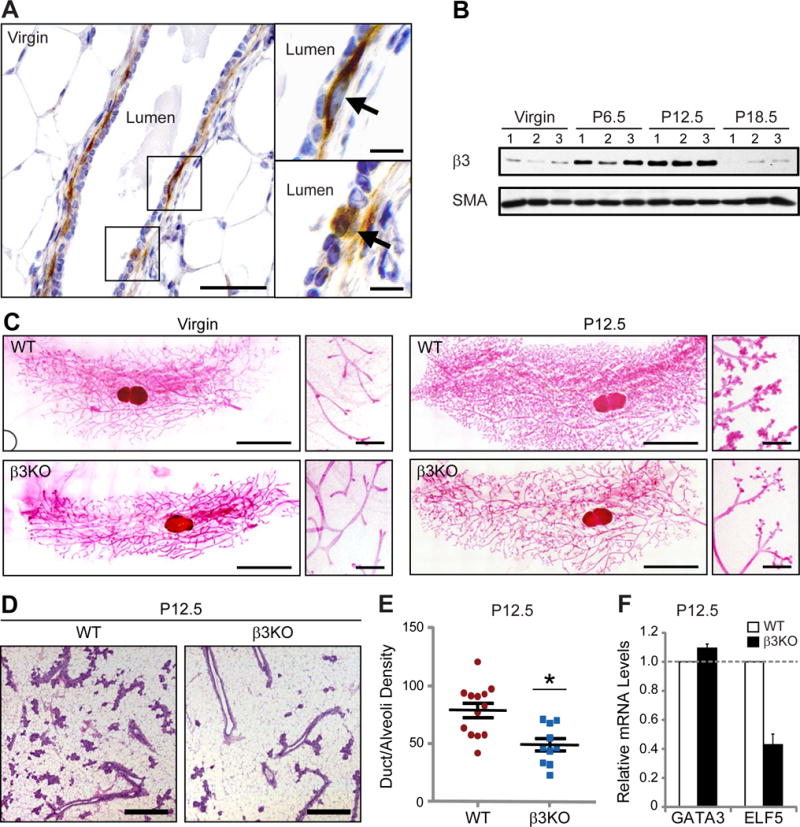
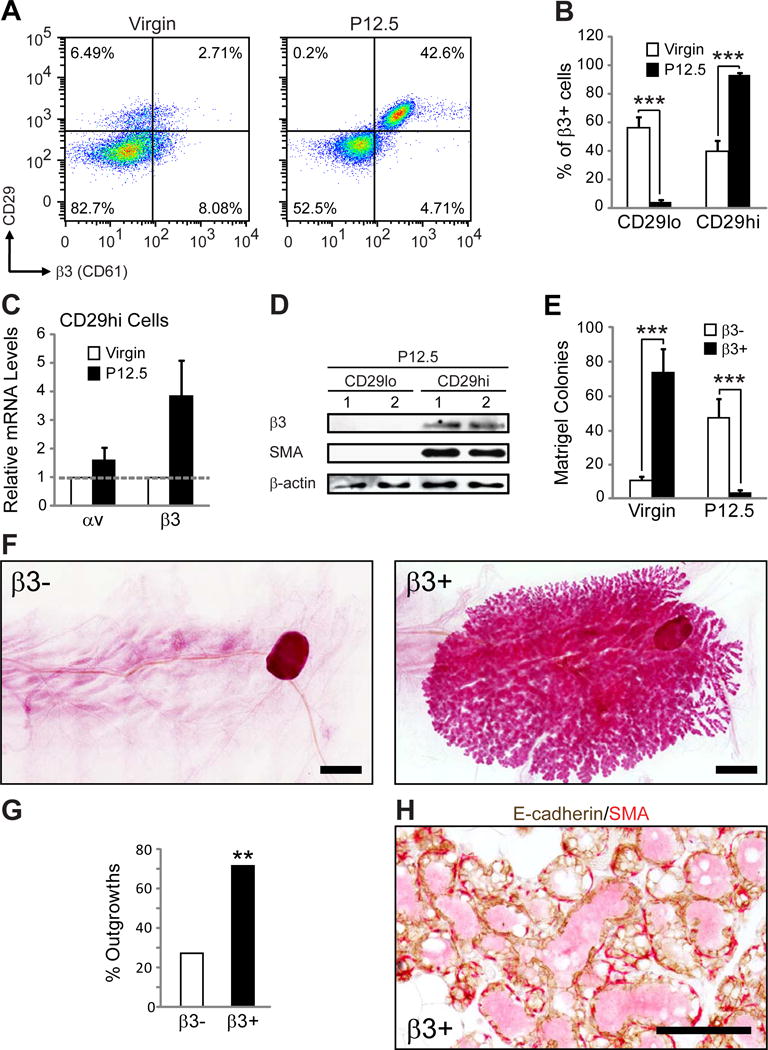
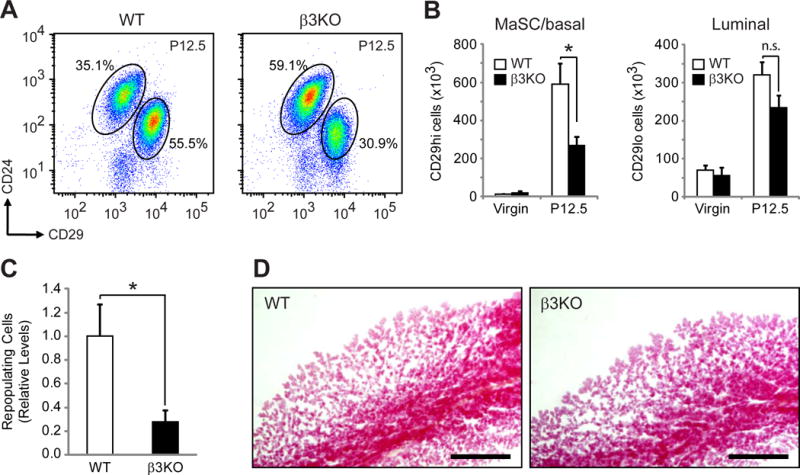
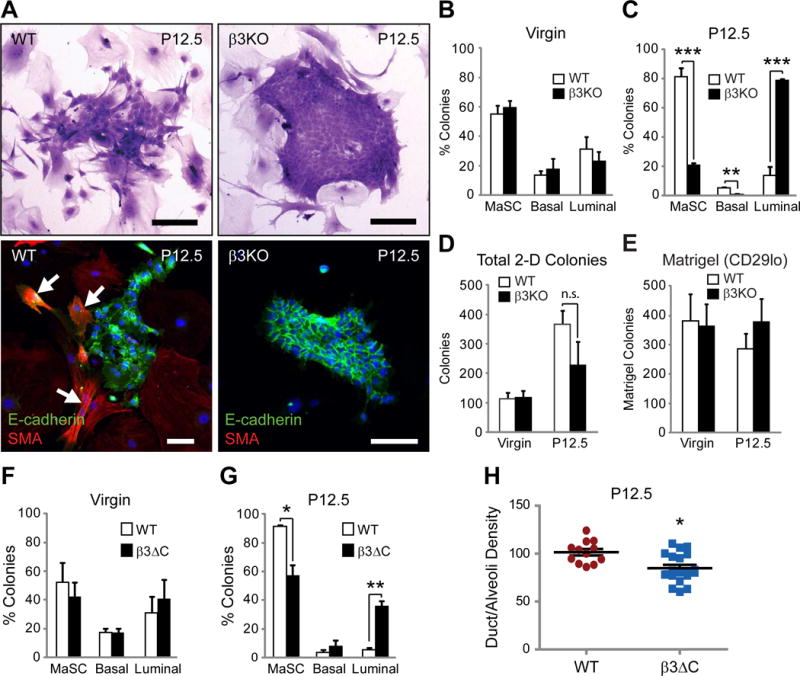
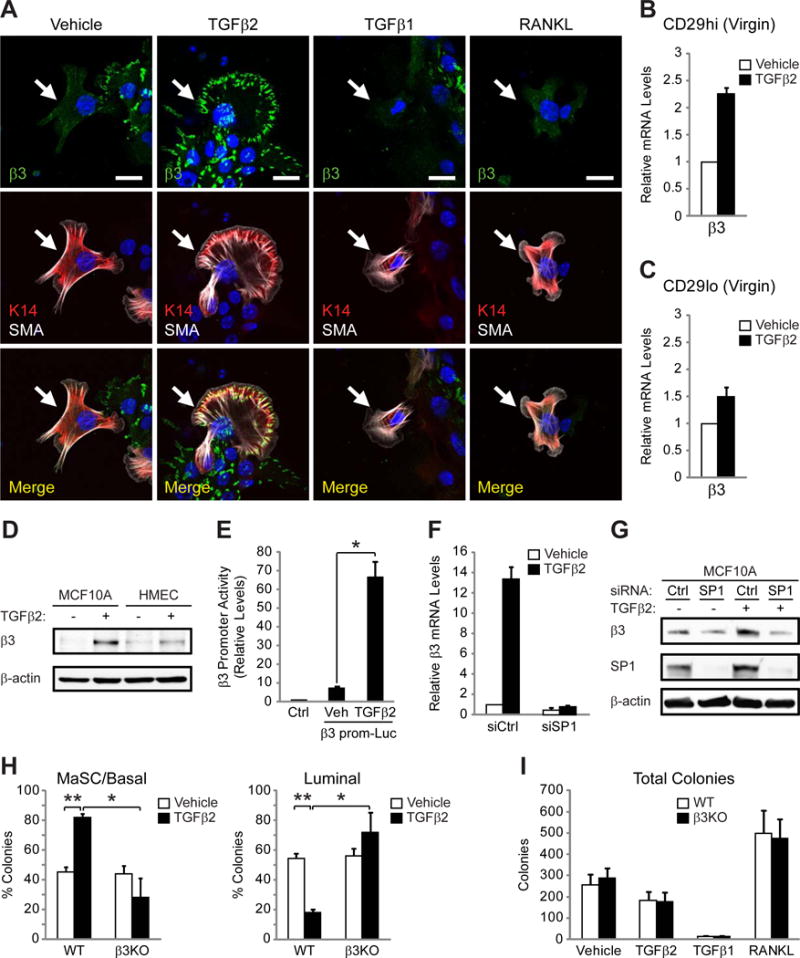
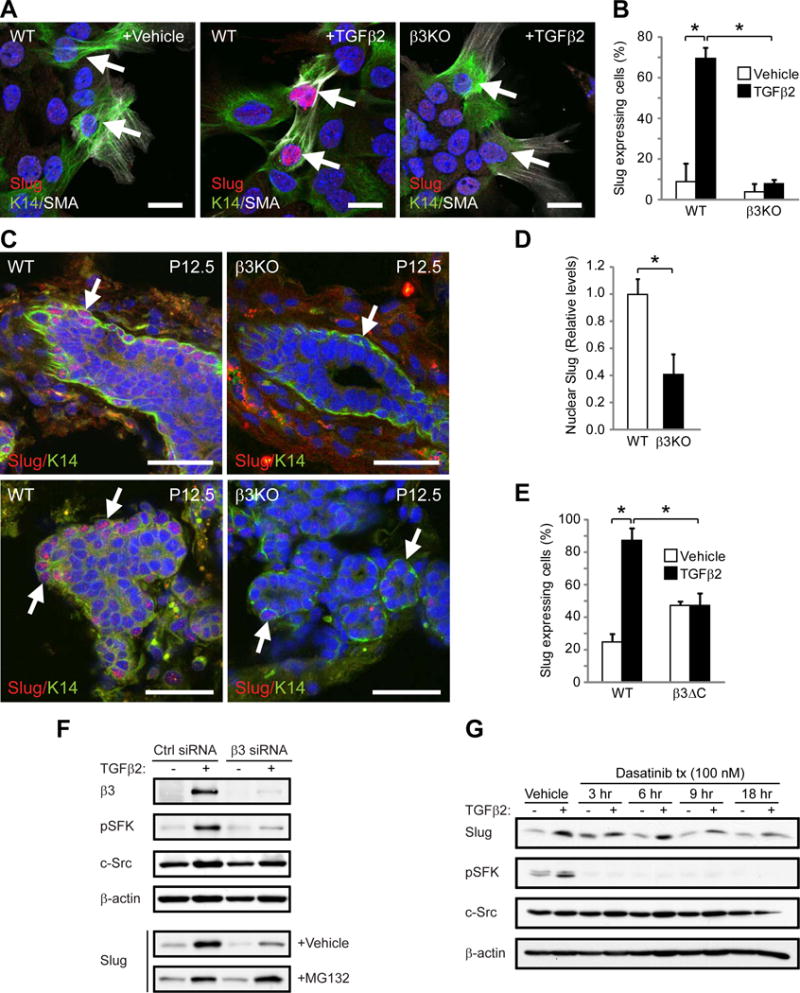
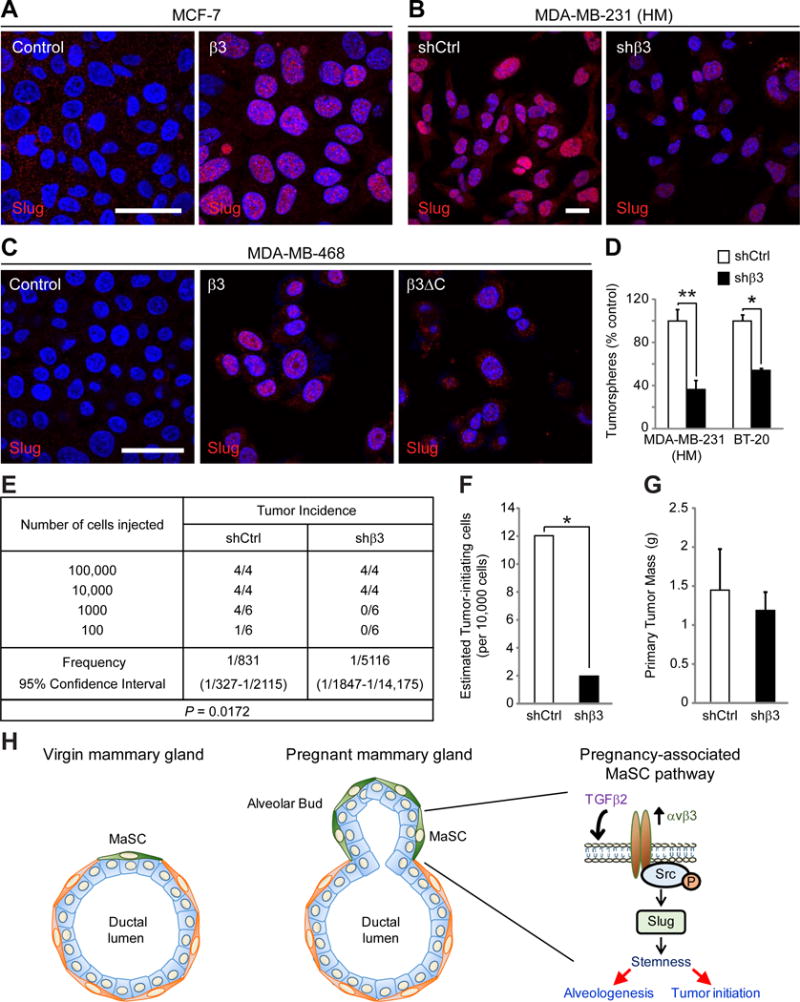
Although integrin αvβ3 is linked to cancer progression, its role in epithelial development is unclear. Here, we show that αvβ3 plays a critical role in adult mammary stem cells (MaSCs) during pregnancy. Whereas αvβ3 is a luminal progenitor marker in the virgin gland, we noted increased αvβ3 expression in MaSCs at midpregnancy. Accordingly, mice lacking αvβ3 or expressing a signaling-deficient receptor showed defective mammary gland morphogenesis during pregnancy. This was associated with decreased MaSC expansion, clonogenicity, and expression of Slug, a master regulator of MaSCs. Surprisingly, αvβ3-deficient mice displayed normal development of the virgin gland with no effect on luminal progenitors. Transforming growth factor β2 (TGF-β2) induced αvβ3 expression, enhancing Slug nuclear accumulation and MaSC clonogenicity. In human breast cancer cells, αvβ3 was necessary and sufficient for Slug activation, tumorsphere formation, and tumor initiation. Thus, pregnancy-associated MaSCs require a TGF-β2/αvβ3/Slug pathway, which may contribute to breast cancer progression and stemness.


Figures

Figure 1
Figure 1. β3 is specifically required for mammary gland development during pregnancy
(A) Representative images of β3 immunohistochemistry in an adult virgin murine mammary gland. Shown is an example of a duct (left panel) with areas in boxes shown at high-power (right panels). Images on right show β3-expressing cells (arrows) in the basal epithelial cell layer (top, right) and a subset of luminal epithelial cells (bottom, right). Scale bars, 50 μm (left panel) and 10 μm (right panels). (B) Western blot of whole mammary gland lysates for β3 and α-smooth muscle actin (SMA) (loading control). n=3 mice for each stage. (C) Mammary gland whole-mounts from virgin and P12.5 WT and β3KO mice. Virgin; WT, n=8, β3KO, n=7, P12.5; WT, n=19, β3KO, n=10. Scale bars, 5 mm (low magnification), and 500 μm (high magnification). (D) Representative H&E-stained sections from WT and β3KO P12.5 mammary glands. Scale bars, 500 μm. (E) Quantitation of duct/alveoli density in P12.5 WT versus β3KO H&E-stained mammary gland sections. WT, n=13, β3KO, n=10, P=0.015. Data shown represent the mean ± s.e.m. and were analyzed by Student’s T-test. *P<0.05. (F) qPCR results displaying the relative amount of GATA3 and ELF5 mRNA in WT and β3KO P12.5 mammary glands. WT, n=11, β3KO, n=9. Each sample was run in triplicate and GAPDH was used as a loading control. Data is displayed as the mean ± s.d. fold change (2−ΔΔCT) in β3KO glands relative to WT. See also Figures S1 and S2.
Figure 2
Figure 2. β3 expression is increased in MaSCs during pregnancy
(A,B) FACS analysis of MaSC/progenitor markers in virgin and P12.5 WT mammary glands. (A) Representative FACS density plots showing the live, LinCD24+ cells expressed according to their CD29 (β1 integrin) and β3 status. (B) Histograms showing the percent of LinCD24+β3+ cells that are CD29lo or CD29hi. P-values for virgin versus P12.5: CD29lo; P=0.00014, CD29hi; P=0.00008. Data shown are mean ± s.e.m. and were analyzed by Student’s T-tests. ***P<0.001. (A,B) Virgin, n=8, P12.5, n=13. (C) qPCR data showing the relative levels of αv and β3 mRNA in virgin and P12.5 CD29hi cells. Virgin, n=2 (pooled from 2 mice each), P12.5, n=3. Each sample was run in triplicate and 18S rRNA was used as a loading control. Data is displayed as the mean ± s.e.m. fold change (2−ΔΔCT) in P12.5 relative to virgin glands. (D) Immunoblot of FACS-sorted LinCD24+ CD29lo and CD29hi mammary cells from two different P12.5 WT mice for β3, SMA (basal marker) and β-actin (loading control). (E) Matrigel colonies from live LinCD24+β3+ and β3 cells sorted from virgin or P12.5 WT mice. Virgin, n=4, P=0.00003, P12.5, n=4, P=0.0014. Data represent the mean ± s.e.m. and were analyzed by paired Student’s T-tests. ***P<0.001. (F–H) Mammary gland outgrowth experiments. (F) Representative images of carmine-stained mammary gland outgrowth whole-mounts from P12.5 LinCD24+β3+ and β3 donor cells. Recipients were harvested at lactating day 2. Scale bars, 2 mm. (G) Bar graph showing the frequency of successful mammary gland outgrowths from 10,000 LinCD24+β3+ and β3 donor cells from P12.5mice. Statistical analysis was performed by Fisher’s exact test. P=0.006. **P<0.01. (H) Representative image of immunohistochemical staining for E-cadherin (brown) and αSMA (red) in sections from LinCD24+β3+ cell outgrowths. Scale bar, 100 μm. (F–H) β3, n=22, β3+, n=21 mammary glands from 3 independent experiments. See also Figure S3.
Figure 3
Figure 3. β3 is required for MaSC expansion during pregnancy
(A,B) FACS analysis of WT and β3KO virgin and P12.5 mammary glands. (A) Representative FACS density plots of WT and β3KO P12.5 mammary cells showing the live, Lin cells expressed according to their CD24 and CD29 status. (B) Quantitation of the total number of FACS-sorted live LinCD24+CD29hi and CD29lo cells from virgin and P12.5 mammary glands. P-values for WT versus β3KO at P12.5: MaSC; P=0.027, Luminal; P=0.09. (A,B) Virgin; WT, n=4, β3KO, n=4, P12.5; WT, n=7, β3KO, n=8. (C) Histogram showing the relative levels of total repopulating cells in the CD29hi pool from WT and β3KO P12.5 donor mice. n=4 independent experiments. (B,C) Data represent the mean ± s.e.m. and statistical analysis was performed by Student’s T-tests. *P<0.05. (B) n.s. = not significant (P>0.05). (D) Representative images of carmine-stained WT and β3KO outgrowths harvested at lactating day 2. Scale bars, 1 mm. See also Figure S4.
Figure 4
Figure 4. β3 signaling is required for pregnancy-associated MaSC colony formation
(A) Representative images of WT and β3KO P12.5 colony morphology on irradiated fibroblasts by crystal violet staining (top panels) or immunofluorescent staining for E-cadherin and SMA (bottom panels). Nuclei are stained blue in all panels. Arrows mark SMA-positive cells. Scale bars, 100 μm. (B–D) Quantitation of the percent MaSC, basal, and luminal colonies (B,C) and total colony number (D) from virgin and P12.5 WT and β3KO mice. Virgin; WT, n=6, β3KO, n=6, P12.5; WT, n=5, β3KO, n=4. (C) P-values for WT versus β3KO at P12.5: MaSC; P=0.0004, Basal; P=0.005, Luminal; P=0.0004. (D) n.s. = not significant (P>0.05). (E) Histogram depicting colony formation in Matrigel from FACS-sorted CD29lo WT and β3KO cells from virgin and P12.5 mice. Virgin; WT, n=4, β3KO, n=4, P12.5; WT, n=4, β3KO, n=4. (F,G) MaSC, basal and luminal colonies formed from virgin (F) or P12.5 (G) WT and β3ΔC mammary cells grown on irradiated MEF’s. Virgin; WT, n=2, β3ΔC, n=2, P12.5; WT, n=5, β3ΔC, n=4. (H) Quantitation of duct/alveoli density in P12.5 WT versus β3ΔC H&E-stained mammary gland sections. WT, n=12, β3ΔC, n=20. (B–H) Data represent the mean ± s.e.m. and statistical analysis performed by Student’s T-tests. *P<0.05, **P<0.01 ***P<0.001. See also Figure S5.
Figure 5
Figure 5. TGFβ2 stimulates β3 expression, enhancing MaSC clonogenicity
(A) Representative immunofluorescent images of β3 expression in K14+SMA+ cells (arrows) from pooled virgin WT mammary cells stimulated with the indicated growth factors. Nuclei are stained blue in all panels. Scale bars, 20 μm. Data shown are representative of 3 independent experiments. (B,C) qPCR analysis comparing the relative levels of β3 mRNA in vehicle versus TGFβ2-stimulated CD29hi (B) and CD29lo (C) cells from WT virgin mice. n=2 independent experiments (pooled samples). (D) Immunoblot for β3 and β-actin (loading control) in MCF10As and human mammary epithelial cells (HMECs) stimulated with TGFβ2 or vehicle control. Data shown is representative of 3 independent experiments. (E) Histogram displaying the relative luciferase activity in MCF10A cells transfected with an empty vector (Ctrl) or a luciferase reporter plasm id containing the proximal region of the β3 promoter (β3 prom-Luc) and stimulated with vehicle or TGFβ2. n=3 independent experiments. P=0.043. (F,G) A representative experiment showing the effect of SP1 knock-down on β3 mRNA (F) and protein (G) expression in MCF10A cells stimulated with TGFβ2 or vehicle control. MCF10A cells transfected with control (siCtrl) or SP1 siRNA (siSP1) were analyzed for β3 mRNA expression by qPCR (F) or β3 protein by immunoblot (G) in the same experiment. n=3 independent experiments. (B,C,F) Each sample was run in triplicate and 18S rRNA (B,C) or β-actin (F) were used as loading controls. Data is displayed as the mean ± s.e.m. fold change (2−ΔΔCT). (H,I) Quantitation of the percent MaSC/basal, and luminal colonies (H) and total colony number (I) from pooled virgin WT and β3KO mammary cells stimulated with the indicated growth factors. n=3 independent experiments. (H) P-values for vehicle versus TGFβ2 in WT cells: MaSC; P=0.0071, Luminal; P=0.0071, and WT versus β3KO cells stimulated with TGFβ2: MaSC; P=0.0413, Luminal; P=0.0413. (E,H,I) Data represent the mean ± s.e.m. and statistical analysis performed by Student’s T-tests. *P<0.05, **P<0.01.
Figure 6
Figure 6. β3 is required for Slug activation in response to TGFβ2 or pregnancy
(A,B) Slug expression in K14+SMA+ cells from virgin WT and β3KO mammary cells stimulated with vehicle or TGFβ2. (A) Representative images of Slug expression in K14+SMA+ cells (arrows). Scale bars, 20 μm. (B) Quantitation of the percentage of Slug+K14+SMA+ cells. P=0.0439 (vehicle versus TGFβ2 in WT cells) and P=0.0342 (WT versus β3KO cells stimulated with TGFβ2). (A,B) WT, n=3, β3KO, n=3. (C,D) Slug expression in WT and β3KO P12.5 mammary glands. (C) Representative images of Slug in K14+ cells (arrows). Scale bars, 20 μm. (A,C) Nuclei are stained blue in all panels. (D) Histogram showing the relative levels of nuclear Slug expression. Data for each mouse represents the average nuclear Slug expression from 5 fields normalized to total nuclear stain. P=0.0113. (C,D) WT, n=8, β3KO, n=6. (E) Quantitation of the percentage of Slug-expressing K14+SMA+ cells from virgin WT and β3ΔC mammary cells stimulated with vehicle or TGFβ2. WT, n=2, β3ΔC, n=2. P=0.029 (vehicle versus TGFβ2 in WT cells) and P=0.032 (WT versus β3ΔC cells stimulated with TGFβ2). (B,D,E) Data represent the mean ± s.e.m. and statistical analysis performed by Student’s T-tests. *P<0.05. (F,G) Immunoblots of MCF10A cells stimulated with TGFβ2 or vehicle control and probed for the indicated proteins. (F) Cells were transfected with Control (Ctrl) or β3 siRNA and additionally treated with vehicle or proteasome inhibitor (MG132) for 5 hr prior to lysis. (G) Cells were treated with 100 nM Src inhibitor (Dasatinib) for the indicated length of time prior to lysis. (F,G) Data shown is representative of 3 independent experiments. See also Figures S6 and S7.
Figure 7
Figure 7. αvβ3 is associated with Slug activation and stemness in human breast cancer cells
(A–C) Representative immunofluorescent images showing Slug expression in (A) MCF-7 cells stably transfected with β3 cDNA or vector alone (Control) (B) a highly metastatic (HM) variant of MDA-MB-231 cells stably expressing a non-silencing (shCtrl) or β3 shRNA (shβ3) and (C) MDA-MB-468 cells stably expressing vector control, full-length β3 or the β3ΔC mutant. (A–C) Nuclei are stained blue in all panels. Scale bars 20 μm. (D) Histogram depicting the results of β3 knock-down on soft agar colony number in MDA-MB-231 (HM) or BT-20 human tumor cell lines compared to control. MDA-MB-231 (HM), n=3, P=0.0079, BT-20, n=2, P=0.031. (E–G) In vivo tumor initiation studies comparing control and β3 knock-down MDA-MB-231 (HM) cells injected orthotopically into adult female mice at limiting dilution. (E) Table describing the frequency of tumor formation per fat pad injected for each cell type. (F) Histogram showing the estimated number of tumor-initiating cells from the data in (E). (G) Bar graph depicting the primary tumor mass for each cell type in tumors formed after injection of 10,000 cells and harvested at 6 weeks. (D,G) Data represent the mean ± s.e.m. and statistical analysis performed by Student’s T-test. *P<0.05, **P<0.01. (H) Schematic describing the function of the αvβ3-Src-Slug signaling axis in MaSC expansion during pregnancy. Compared to the virgin mammary gland (left panel) pregnancy induces expansion of the MaSC population (green cells), resulting in the initiation of alveologenesis (middle panel). Factors released during pregnancy, such as TGFβ2, drive αvβ3 expression in these pregnancy-associated MaSCs, resulting in activation of Src family kinases and increased levels of Slug (right panel). This pathway may lead not only to MaSC expansion and alveologenesis during pregnancy, but may additionally contribute to stem-like properties in breast cancer cells, resulting in tumor initiation. See also Figure S7.

Comment in

References

    1. Ablooglu AJ, Kang J, Petrich BG, Ginsberg MH, Shattil SJ. Antithrombotic effects of targeting alphaIIbbeta3 signaling in platelets. Blood. 2009;113:3585–3592. - PMC - PubMed
    1. Al-Hajj M, Wicha MS, Benito-Hernandez A, Morrison SJ, Clarke MF. Prospective identification of tumorigenic breast cancer cells. Proc Natl Acad Sci U S A. 2003;100:3983–3988. - PMC - PubMed
    1. Arias-Salgado EG, Lizano S, Sarkar S, Brugge JS, Ginsberg MH, Shattil SJ. Src kinase activation by direct interaction with the integrin beta cytoplasmic domain. Proc Natl Acad Sci U S A. 2003;100:13298–13302. - PMC - PubMed
    1. Asselin-Labat ML, Shackleton M, Stingl J, Vaillant F, Forrest NC, Eaves CJ, Visvader JE, Lindeman GJ. Steroid hormone receptor status of mouse mammary stem cells. J Natl Cancer Inst. 2006;98:1011–1014. - PubMed
    1. Asselin-Labat ML, Sutherland KD, Barker H, Thomas R, Shackleton M, Forrest NC, Hartley L, Robb L, Grosveld FG, van der Wees J, et al. Gata-3 is an essential regulator of mammary-gland morphogenesis and luminal-cell differentiation. Nat Cell Biol. 2007;9:201–209. - PubMed

Publication types