. 2014 Aug 11;26(2):288-300.
doi: 10.1016/j.ccr.2014.06.005.

Most human non-GCIMP glioblastoma subtypes evolve from a common proneural-like precursor glioma

Affiliations

Most human non-GCIMP glioblastoma subtypes evolve from a common proneural-like precursor glioma

Tatsuya Ozawa et al. Cancer Cell. .

Abstract

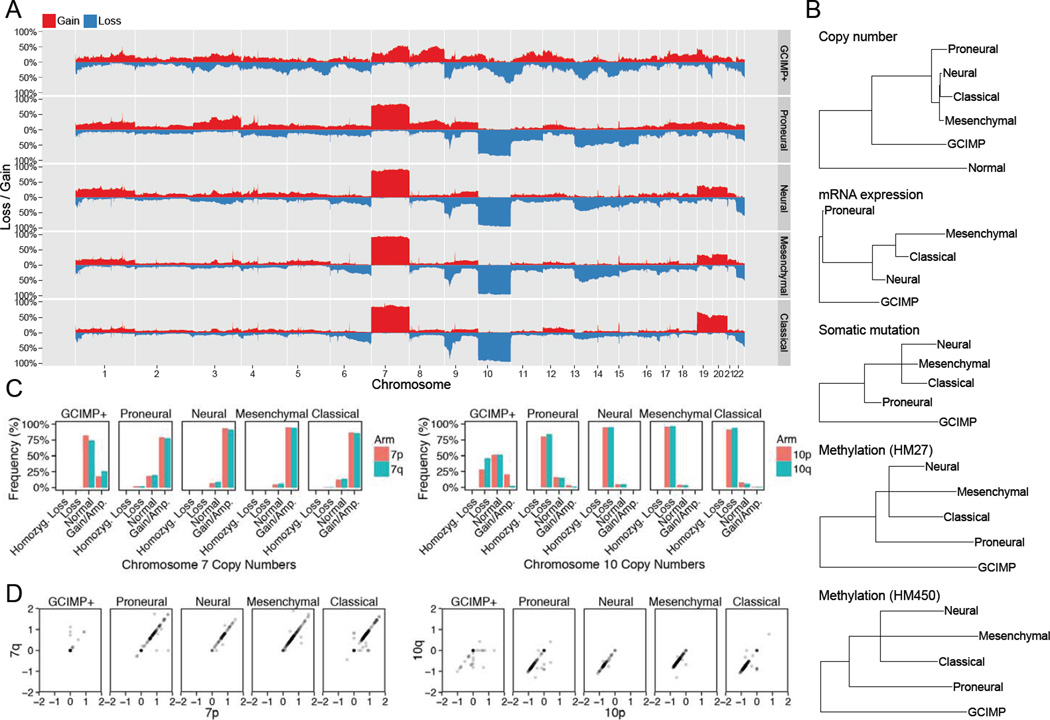
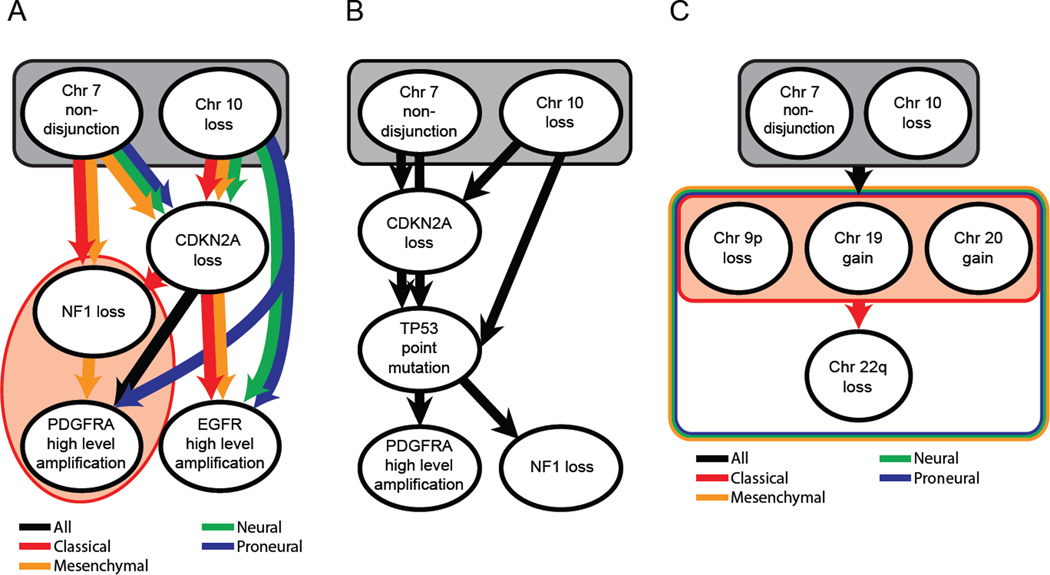
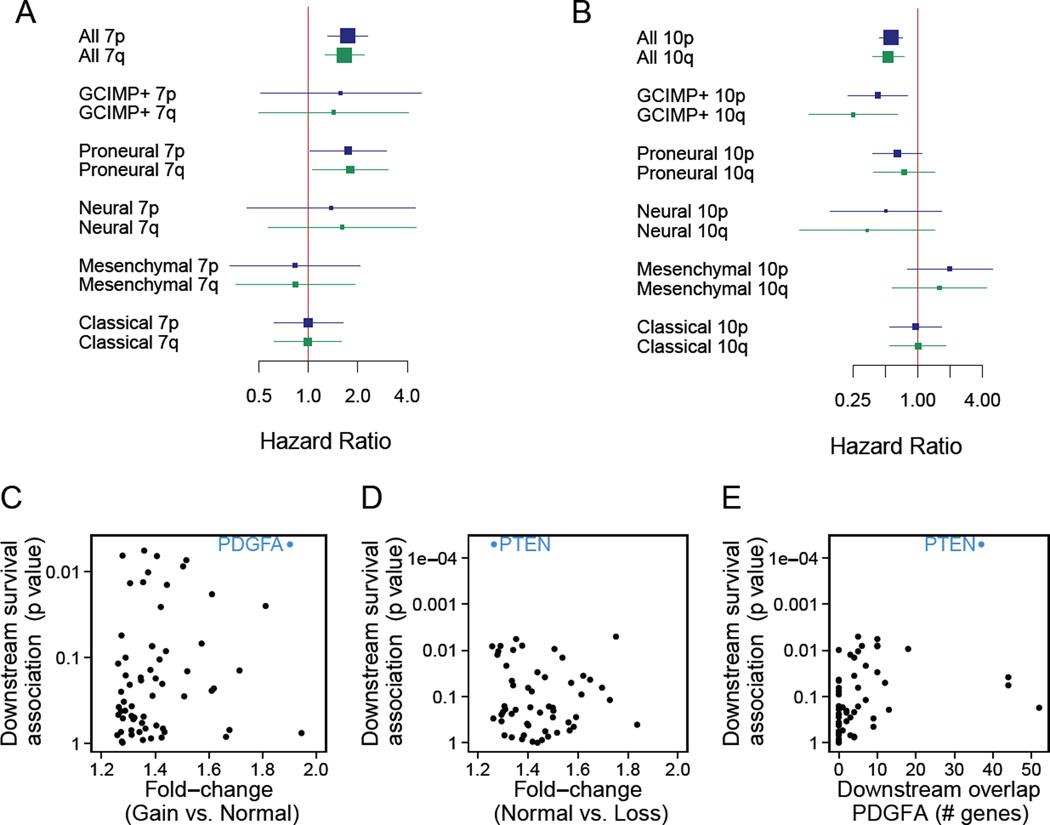
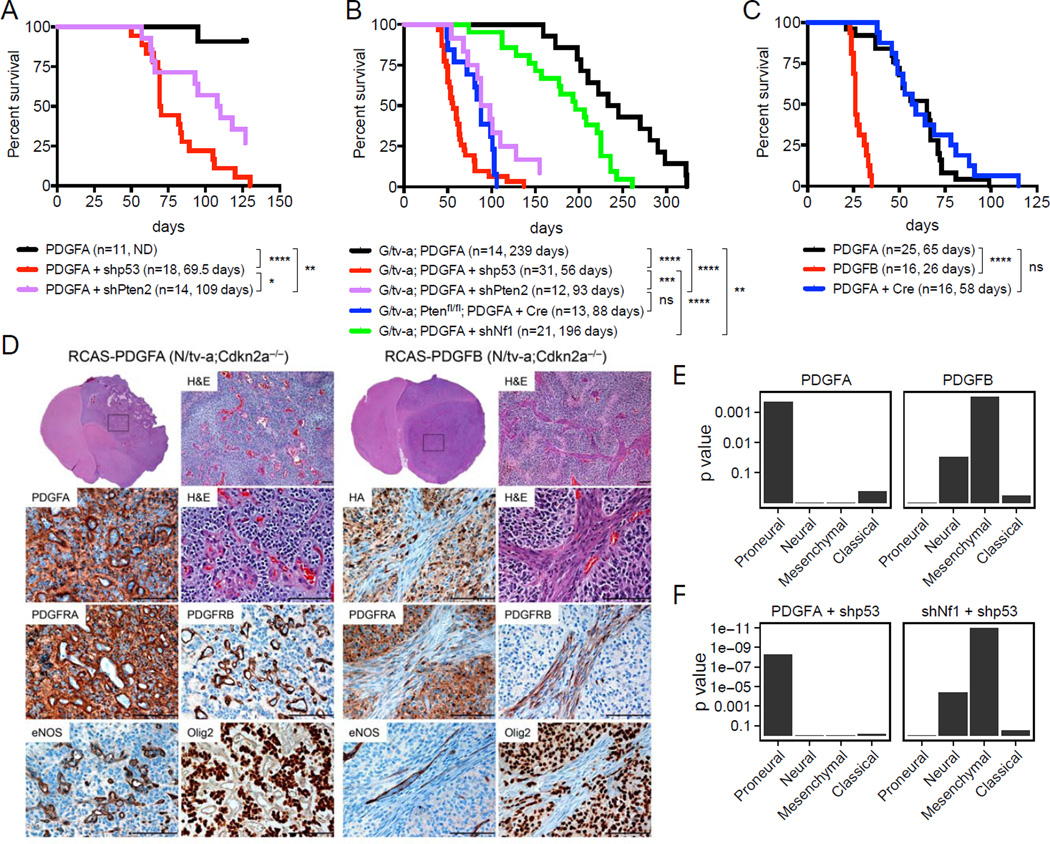
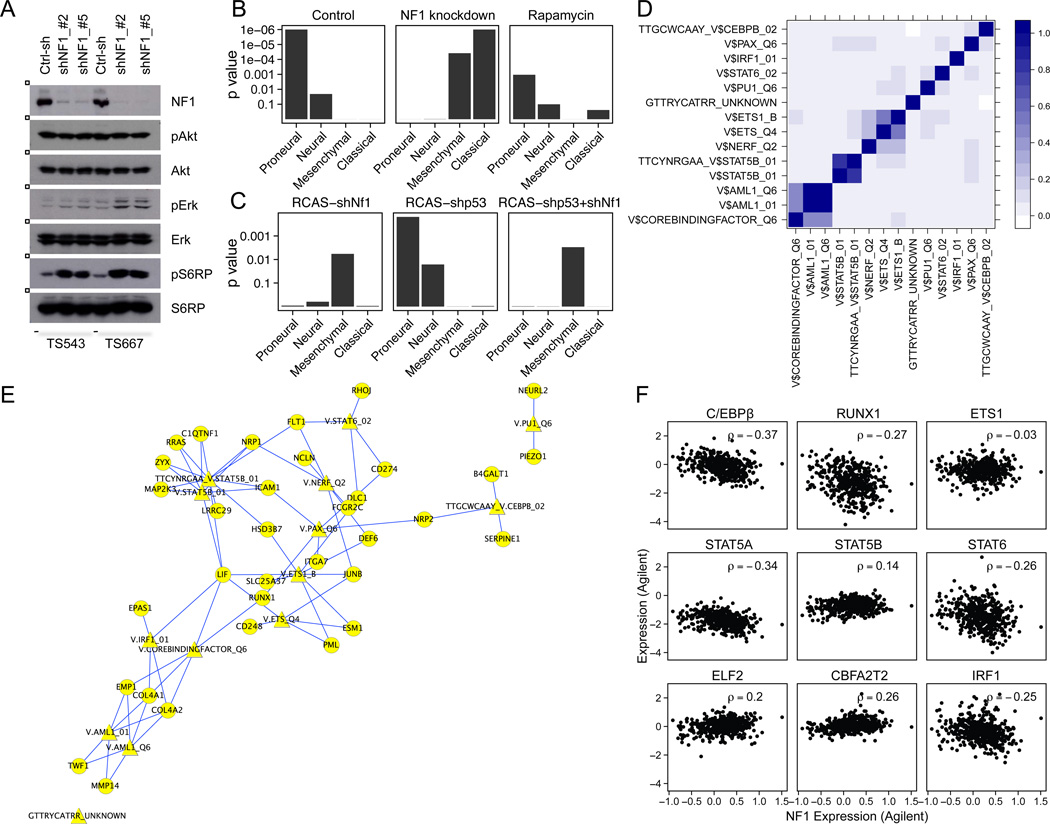
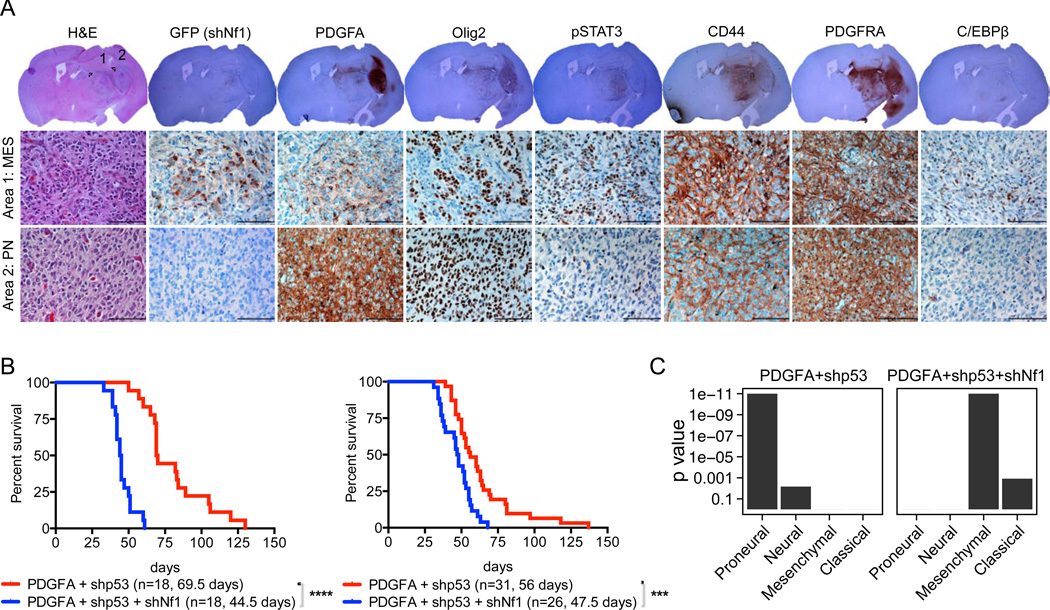
To understand the relationships between the non-GCIMP glioblastoma (GBM) subgroups, we performed mathematical modeling to predict the temporal sequence of driver events during tumorigenesis. The most common order of evolutionary events is 1) chromosome (chr) 7 gain and chr10 loss, followed by 2) CDKN2A loss and/or TP53 mutation, and 3) alterations canonical for specific subtypes. We then developed a computational methodology to identify drivers of broad copy number changes, identifying PDGFA (chr7) and PTEN (chr10) as driving initial nondisjunction events. These predictions were validated using mouse modeling, showing that PDGFA is sufficient to induce proneural-like gliomas and that additional NF1 loss converts proneural to the mesenchymal subtype. Our findings suggest that most non-GCIMP mesenchymal GBMs arise as, and evolve from, a proneural-like precursor.


Figures

Figure 1
Figure 1. Somatic copy number alterations and their frequencies in GBM
(A) Genome plot visualizes frequencies of copy number gains (red) and losses (blue) along the genome in GCIMP tumors and the 4 non-GCIMP subtypes (proneural, neural, mesenchymal and classical GBM). (B) Phylogenetic analysis in all GBM samples determining the putative evolutional order in GBM subtypes using all data types (copy number, mRNA expression, somatic mutation and methylation) and the Neighbor Joining algorithm. Artificial samples with exactly 2 copies in the whole genome serve as normal copy number control. For DNA methylation analysis, both HM27 and HM450 platform is shown. (C) Histograms showing the frequencies of whole arm gains and losses of both chr7 and chr10 in each subtype separately. (D) Copy numbers of the p and q arms of chr7 and chr10 for all TCGA samples stratified by GBM subtype. See also Figure S1 and Tables S1–S3
Figure 2
Figure 2. Temporal sequence of events in glioma development
(A) Order of events for subtype-specific copy number alterations per subtype. (B) Order of events for all GBM samples for which TP53 point mutation data was available (n=85). (C) Order of chromosome level copy number alterations. Black ovals represent distinct mutational events. Arrows represent an ordering of events detected by RESIC. Rectangles containing events represent sets of events where RESIC cannot distinguish an order of events. Black denotes orderings that are shared across subtypes. Red, Yellow, Green and Blue denotes classical, mesenchymal, neural and proneural subtype specific orderings, respectively. Orderings shared by multiple subtypes but not all subtypes are denoted by multicolored arrows and rectangles. See also Figure S2.
Figure 3
Figure 3. Drivers of chr7 and chr10 alterations in the proneural subtype
(A-B) Forest plots showing the Hazard Ratios (HR, squares) of chr7 gain (A) and chr10 loss (B) and their confidence intervals. HR significantly larger than 1 (A) or lower than 1 (B) signify a copy number change associated with poor prognosis. Square size is proportional to the sample size. (C, D) Genes on chr7 (C) and chr10 (D) ranked by association of downstream genes with overall survival, with the corresponding p values shown on the y-axis. Genes were considered with a fold-change (x-axis) in expression of larger than 1.25 (averaged over both Affymetrix and Agilent platforms) when comparing patients with normal and altered chr7 and chr10 copy numbers. The top-ranking hits are in blue. (E) The overlap in downstream genes of PDGFA in the KEGG pathway database with the top-ranking genes on chr10 (x-axis). See also Figure S3 and Table S4–6.
Figure 4
Figure 4. PDGFA induces gliomas with similar expression pattern to human proneural GBMs in mice. (A-C)
Kaplan-Meier survival curves showing symptom-free survival of PDGFA- or PDGFB-induced gliomas in Nestin (N)/tv-a (A), GFAP (G)/tv-a or G/tv-a;Ptenfl/fl (B), N/tv-a;Cdkn2a−/−;Ptenfl/fl mice (C). Tumors were generated by the injection of the indicated RCAS virus into neonatal brains. (*) p < 0.05, (**) p < 0.005, (***) p < 0.001, (****) p < 0.0001, ns: not significant. (D) Representative H&E and immunohistochemical analysis of the PDGFA- and PDGFB-induced gliomas in N/tv-a;Cdkn2a−/−;Ptenfl/fl mice. Boxes denote the enlarged-region. Scale bars, 100 µm. (E) GSEA of the RCAS-PDGFA-and RCAS-PDGFB-induced gliomas in N/tv-a;Cdkn2a−/−;Ptenfl/fl mice. Gene expression profiles were compared between the PDGFA- (n=7) and PDGFB- (n=5) induced gliomas based on the TCGA subtype signatures (Verhaak et al., 2010). Bar plots visualize enrichment p values (y-axis) of the four subtype signatures in the ranking of genes by differential expression (PDGFA versus PDGFB). A low p value indicates consistent expression with the subtype, i.e., many genes known to be up-regulated in the subtype are up and down-regulated genes are down. (F) GSEA of the RCAS-PDGFA/shp53 and RCAS-shNf1/shp53-induced gliomas in N/tv-a and G/tv-a mice. See also Figure S4 and Table S7
Figure 5
Figure 5. Simultaneous loss of Nf1 and Tp53 induces MES-gliomas in the RCAS/tv-a model
(A) Kaplan-Meier survival curves showing symptom-free survival and relative tumor grade of the RCAS-shNf1/shp53-induced gliomas in N/tv-a and G/tv-a mice. The percentage of tumors exhibiting WHO grades II (G2), III (G3), and IV (GBM) histological features are shown for each genotype. (B) Representative H&E and immunohistochemical analysis for the indicated protein of the RCAS-shNf1/shp53 induced-glioma in G/tv-a mice. The box denotes the enlarged-region. Scale bars, 100 µm. (C) GSEA of the RCAS-shNf1/shp53 induced-gliomas in G/tv-a and N/tv-a mice. See also Figure S5.
Figure 6
Figure 6. AdditionalNF1 loss induces proneural to mesenchymal conversion in vitro and in vivo
(A) Western blot analysis of two human GBM cell lines (TS543 and TS667) expressing controlor NF1-shRNAs (target sequence #2 and #5) with the indicated antibodies. (B) GSEA of human GBM cell lines. Gene expression profiles were compared between untreated cells, 0.1% DMSO or 1nM Rapamycin-treated cells for 5 hours in two different cell lines (TS543 and TS667) expressing controlor NF1-shRNAs. Each sample was analyzed in triplicate. Control-shRNA samples of the TS543 and TS667 cells also have technical duplicate samples. (C) GSEA of murine neurosphere lines. The gene expression profiles were analyzed in between N/tv-a; neurosphere lines expressing RCAS-shGL2, -shNf1, -shp53 or -shNf1/shp53. The subtype gene signature enrichment was determined by comparing control-shRNA sample (shGL2) with each shRNA samples, respectively. Each sample was analyzed in triplicate. (D) The overlap index of the 14 significant gene sets, corresponding to 9 different TFs; high overlaps are shown in dark blue. (E) Cytoscape visualization of the overlap of the 14 significant TF gene sets and the GBM mesenchymal gene signature (Carro et al., 2010). Diamond shaped nodes represent the 14 TF gene sets. Circular nodes represent TF target genes in both the mesenchymal gene signature and the 14 TF gene sets. TFs and target genes are connected by blue edges. The p value for the overlap of the mesenchymal gene signature and the 14 TFs was p = 0.005 (hypergeometric distribution). (F) Correlation of MES-TF expression with NF1 expression in the TCGA Agilent data. p values for C/EBPβ, RUNX1, STAT5A, STAT6 and IRF1 were p < 0.001 anti-correlation with NF1 expression. See also Figure S6.
Figure 7
Figure 7. Additional Nf1 loss induces proneural to mesenchymal conversion in vivo
(A) Representative H&E and immunohistochemical analysis for the indicated protein of the RCAS-PDGFA/shp53 induced-glioma secondary incorporating the RCAS-GFP-shNf1 virus in G/tv-a mice. Circles 1 and 2 represent mesenchymal and proneural tumor lesions, respectively. Scale bars, 100 µm. (B) Kaplan-Meier survival curves showing symptom-free survival of PDGFA/shp53 or PDGFA/shp53/shNf1 induced-gliomas in N/tv-a (Left panel) and G/tv-a (Right panel) mice. Tumors were generated by simultaneous injection of the relevant RCAS virus into neonatal pups brain. Survival curve of the RCAS-PDGFA/shp53 induced-tumors from Figures 4A and 4B were also shown in the figure for the comparison. (***) p = 0.0004, (****) p < 0.0001. (C) GSEA of the RCAS-PDGFA/shp53 and the RCAS-PDGFA/shp53/shNf1 induced-gliomas in N/tv-a and G/tv-a mice.

Comment in

Similar articles

Cited by

References

    1. Andrae J, Gallini R, Betsholtz C. Role of platelet-derived growth factors in physiology and medicine. Genes Dev. 2008;22:1276–1312. - PMC - PubMed
    1. Attolini CS, Cheng YK, Beroukhim R, Getz G, Abdel-Wahab O, Levine RL, Mellinghoff IK, Michor F. A mathematical framework to determine the temporal sequence of somatic genetic events in cancer. Proc Natl Acad Sci U S A. 2010;107:17604–17609. - PMC - PubMed
    1. Baeza N, Weller M, Yonekawa Y, Kleihues P, Ohgaki H. PTEN methylation and expression in glioblastomas. Acta neuropathologica. 2003;106:479–485. - PubMed
    1. Beerenwinkel N, Sullivant S. Markov models for accumulating mutations. Biometrika. 2009;96:645–861.
    1. Bhat KP, Balasubramaniyan V, Vaillant B, Ezhilarasan R, Hummelink K, Hollingsworth F, Wani K, Heathcock L, James JD, Goodman LD, et al. Mesenchymal Differentiation Mediated by NF-kappaB Promotes Radiation Resistance in Glioblastoma. Cancer Cell. 2013;24:331–346. - PMC - PubMed

Publication types

MeSH terms