. 2014 Jul;16(7):543-61.
doi: 10.1016/j.neo.2014.06.003.

Mechanisms of glioma formation: iterative perivascular glioma growth and invasion leads to tumor progression, VEGF-independent vascularization, and resistance to antiangiogenic therapy

Affiliations

Mechanisms of glioma formation: iterative perivascular glioma growth and invasion leads to tumor progression, VEGF-independent vascularization, and resistance to antiangiogenic therapy

Gregory J Baker et al. Neoplasia. 2014 Jul.

Abstract

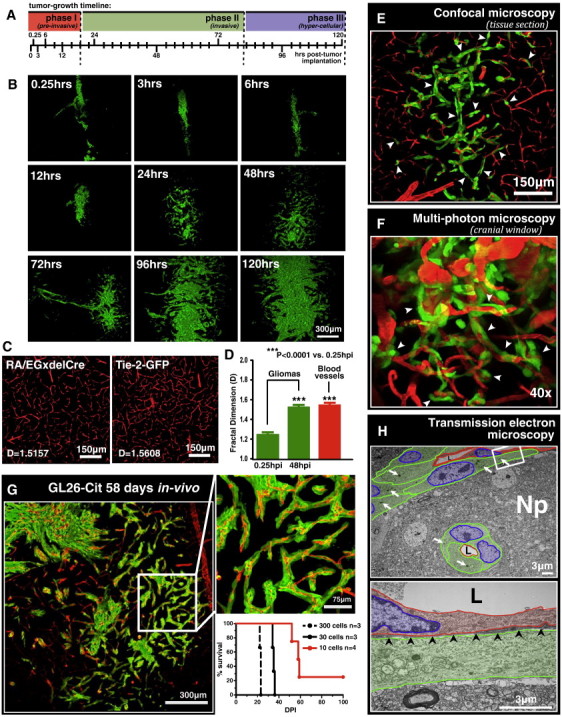
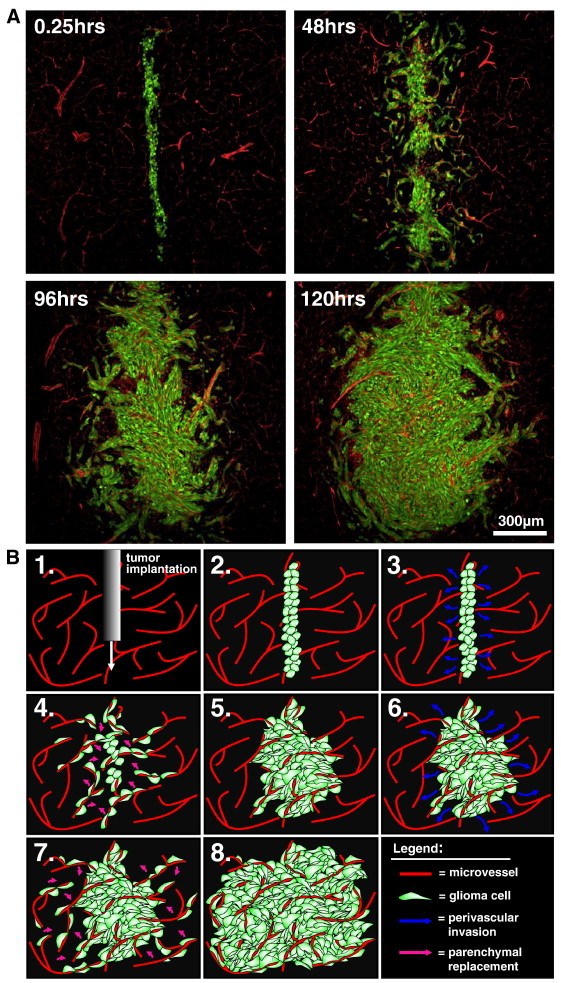
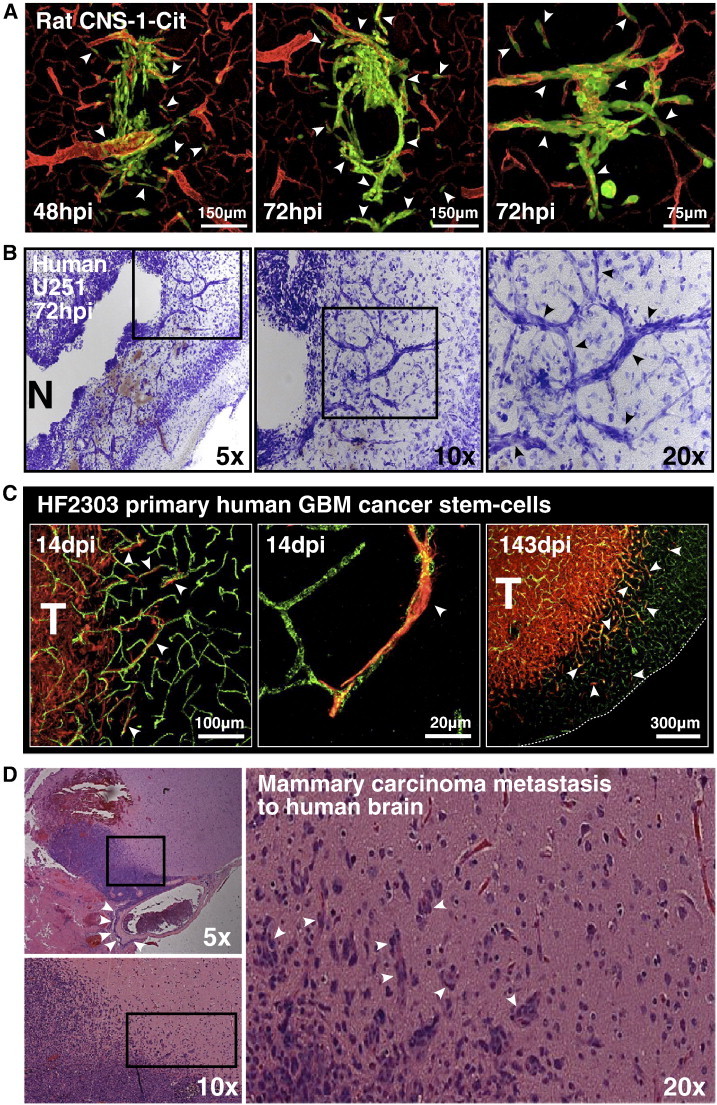
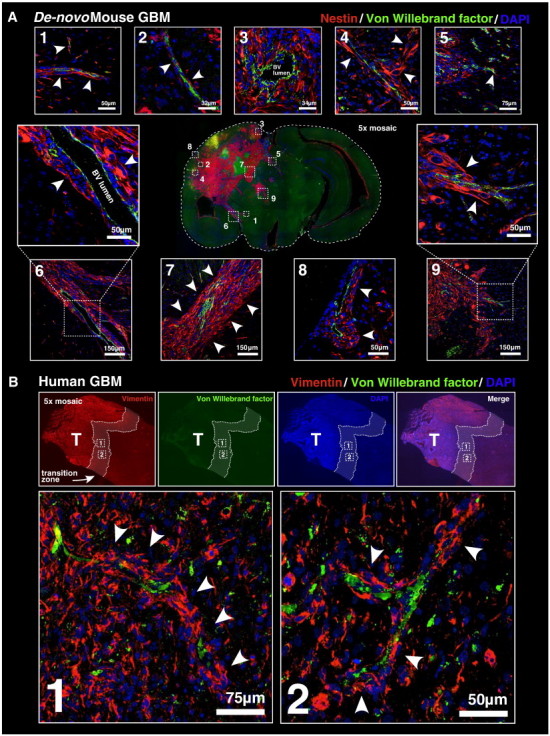
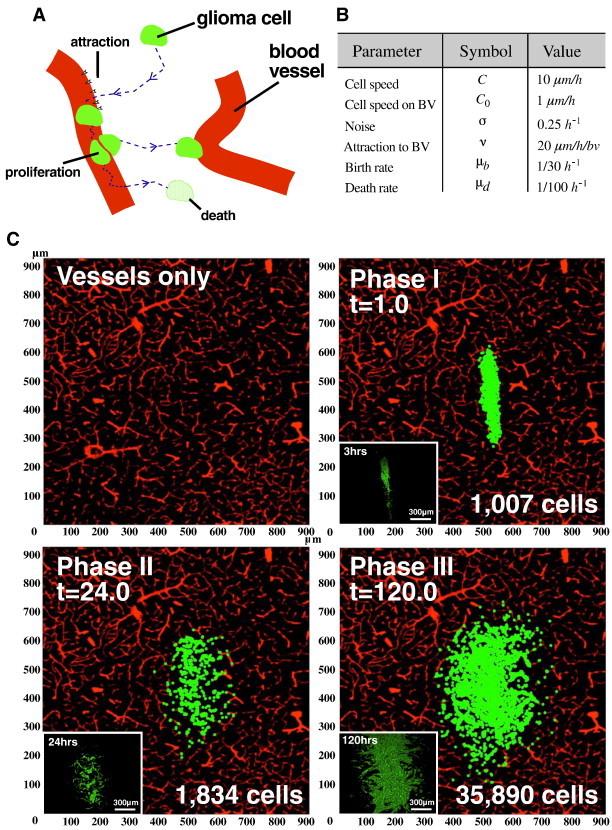
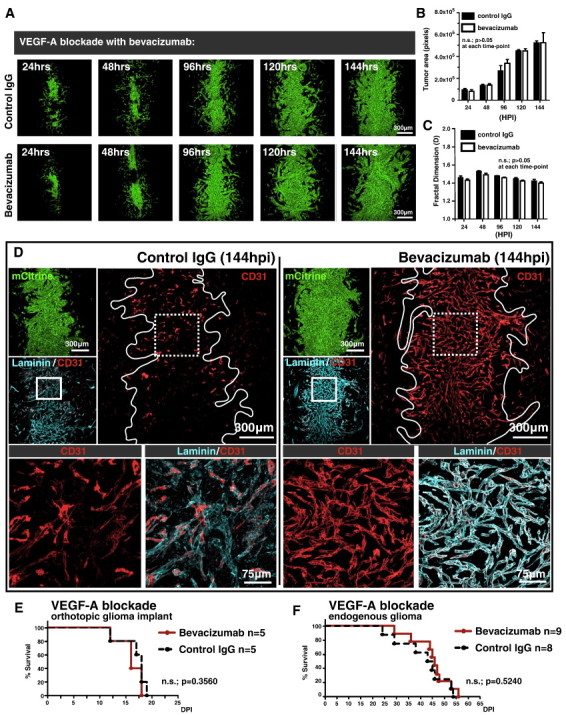
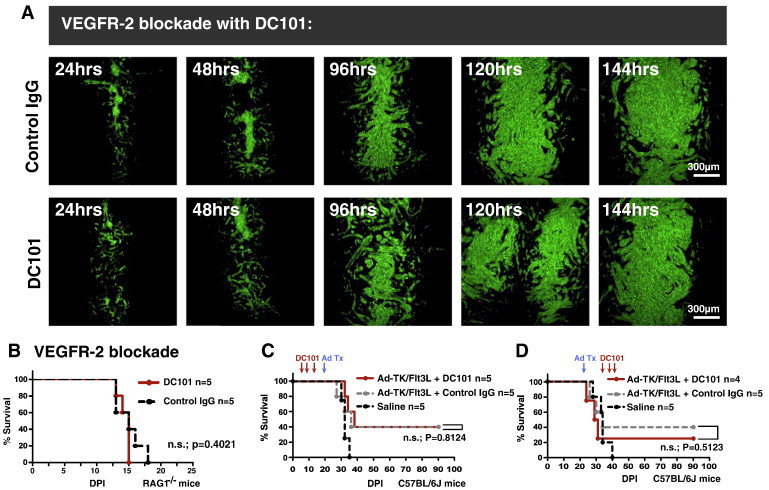
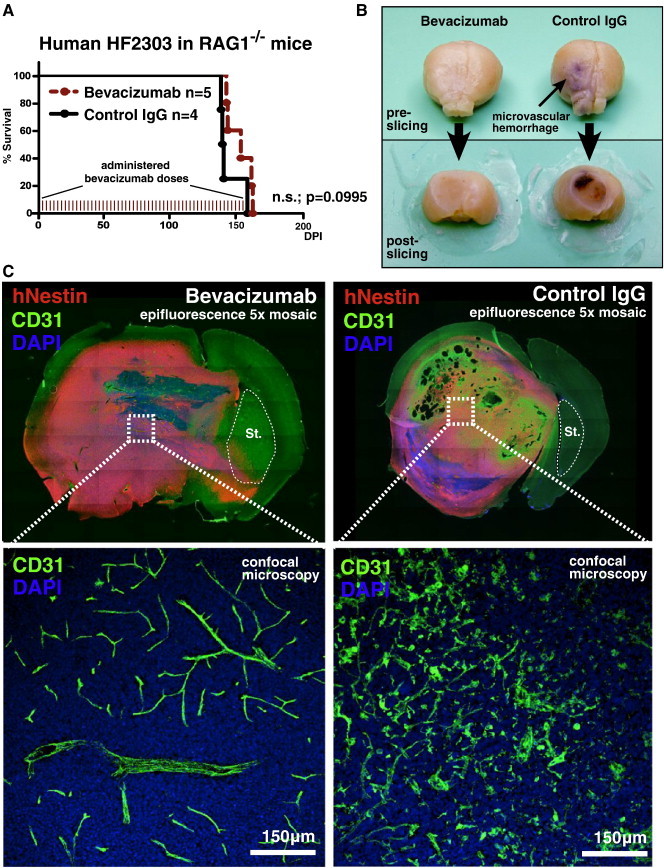
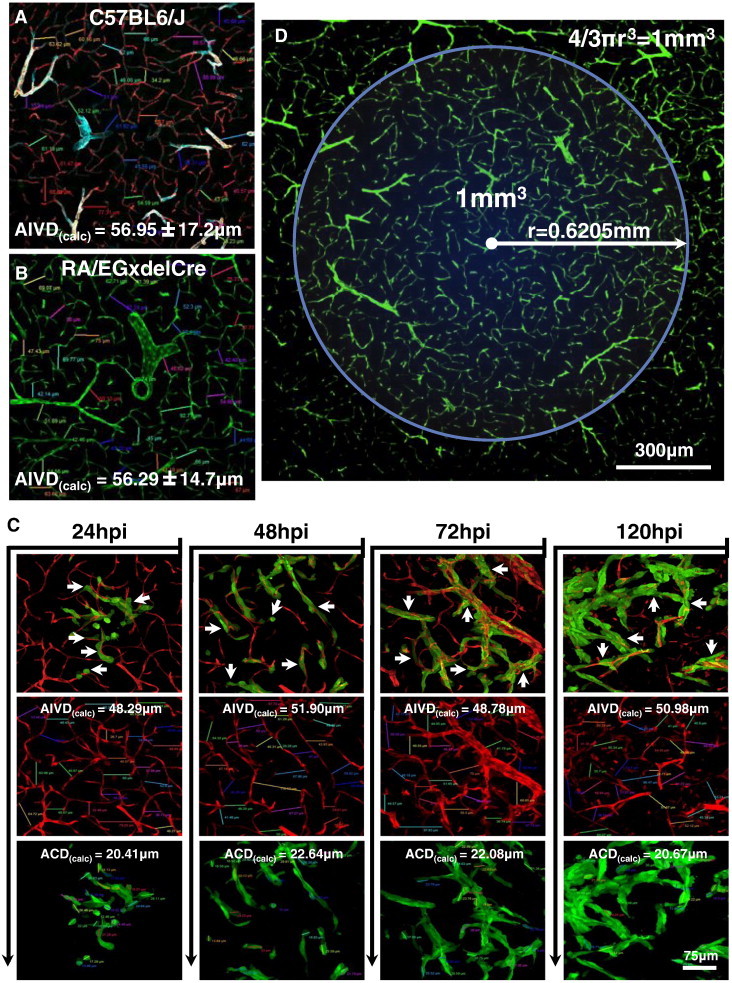
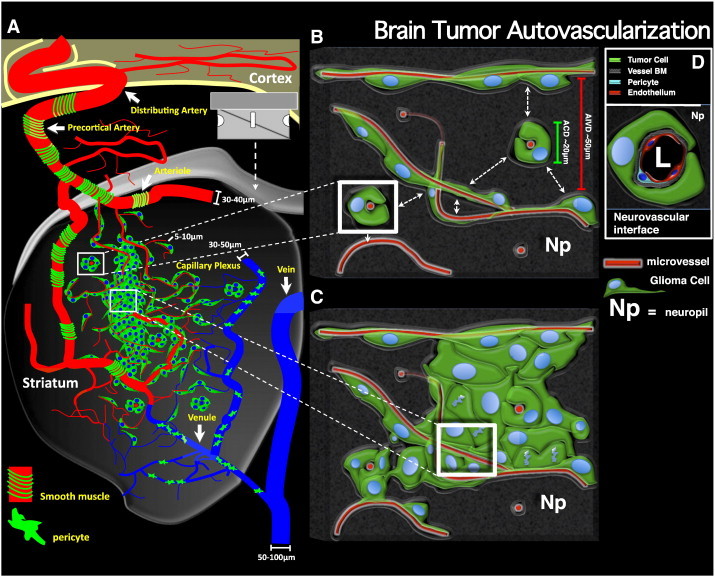
As glioma cells infiltrate the brain they become associated with various microanatomic brain structures such as blood vessels, white matter tracts, and brain parenchyma. How these distinct invasion patterns coordinate tumor growth and influence clinical outcomes remain poorly understood. We have investigated how perivascular growth affects glioma growth patterning and response to antiangiogenic therapy within the highly vascularized brain. Orthotopically implanted rodent and human glioma cells are shown to commonly invade and proliferate within brain perivascular space. This form of brain tumor growth and invasion is also shown to characterize de novo generated endogenous mouse brain tumors, biopsies of primary human glioblastoma (GBM), and peripheral cancer metastasis to the human brain. Perivascularly invading brain tumors become vascularized by normal brain microvessels as individual glioma cells use perivascular space as a conduit for tumor invasion. Agent-based computational modeling recapitulated biological perivascular glioma growth without the need for neoangiogenesis. We tested the requirement for neoangiogenesis in perivascular glioma by treating animals with angiogenesis inhibitors bevacizumab and DC101. These inhibitors induced the expected vessel normalization, yet failed to reduce tumor growth or improve survival of mice bearing orthotopic or endogenous gliomas while exacerbating brain tumor invasion. Our results provide compelling experimental evidence in support of the recently described failure of clinically used antiangiogenics to extend the overall survival of human GBM patients.


Figures

Figure 1
Figure 1
GL26-Cit glioma uses preexisting brain microvasculature as a scaffold for brain tumor invasion. (A) Tumor growth timeline indicating the time points analyzed over the first 120 hours of intracranial GL26-Cit glioma growth. Colored bars represent time frames corresponding to the three distinct phases of early intracranial GL26-Cit glioma growth. (B) Representative fluorescence scanning confocal micrographs of GL26-Cit glioma in the RAG1−/− mouse striatum imaged at the nine predetermined time points indicated in A. (C) Representative fluorescence scanning confocal micrographs of mouse brain microvessels from RA/EGxdelCre (left) and Rag1tm1MomTg(TIE2GFP)287Sato/J (i.e., Tie-2-GFP) (right) mice used to determine the fractal dimension of normal mouse brain microvasculature. Fractal dimension values (D values) for each micrograph are shown. (D) Average D values of gliomas from RAG1−/− mice at 0.25 and 48 hpi (n = 6 mice per group) compared to the average D value of brain microvasculature from the two GFP+ mouse strains represented in C (n = 8; four mice per strain with five distinct striatal regions imaged per mouse). ***P < .0001 versus tumors 0.25 hpi; one-way analysis of variance followed by Tukey post-test. Data represent the mean ± SEM. (E) Fluorescence scanning confocal micrograph of GL26-Cit glioma 48 hpi into the RA/EGxdelCre mouse striatum. GFP+ mouse brain microvessels have been pseudocolored red. White arrowheads point to several examples of microvasculature-associated glioma invasion. (F) Intravital multiphoton micrograph of GL26-Cit glioma imaged through an intracranial window 120 hpi into the somatosensory cortex of the RAG1−/− mouse brain (imaging depth = 129 μm). Mouse brain microvasculature was labeled intraluminally by tail-vein injection of rhodamine B isothiocyanate–conjugated dextran (mw = 70 kDa) before imaging. White arrowheads point to numerous examples of microvasculature-associated tumor invasion. (G) GL26-Cit after 58 days post-tumor implantation into the RAG1−/− mouse brain shown at low (left) and high (right) magnification. Kaplan-Meier survival analysis (lower right) demonstrates that initial injections of low numbers of glioma cells extend animal survival to study late-stage tumor invasion. (H) TEM at low power (top image) showing longitudinal and transverse capillary segments (pseudocolored red) enveloped by perivascularly invading GL26-Cit glioma cells (cytoplasm, green; nuclei, blue) 48 hpi in the RAG1−/− mouse brain. Tumor cells displace the immediately surrounding neuropil as they enter the perivascular space. White arrows indicate USPIOs used to label tumor cells in vitro before implantation. Higher magnification image of the area outlined by the white box is shown below. Black arrowheads in lower micrograph point to the vascular basement membrane covering the adluminal surface of the vascular endothelium. L, vessel lumen.
Figure 2
Figure 2
Perivascular invasion is an iterative growth process. (A) Scanning fluorescence confocal micrographs of GL26-Cit glioma cells from 0.25 to 120 hours in the RA/EGxdelCre mouse brain. Glioma cells are shown in green; brain microvessels are shown in red. (B) Schematic representation of the process of perivascular glioma growth and invasion beginning immediately post-tumor implantation (Step 1-2). Implanted glioma cells initially infiltrate throughout the perivascular space (Step 3-4). Cell division causes normal brain parenchyma present between adjacent microvessels to be displaced by neoplastic tissue, leaving normal brain microvessels within the tumor core (Step 4-5). Iterations of further perivascular invasion and cell division produce well-vascularized brain tumors throughout tumor growth (Steps 6-8).
Figure 3
Figure 3
Brain tumors of diverse species and cellular origin exhibit perivascular invasion. (A) Fluorescence scanning confocal micrographs of fluorescently modified CNS-1-Cit rat glioma cells in the brain of syngeneic Lewis rats after 48 hpi (left image) and 72 hpi (right two images). Brain microvasculature was immunolabeled with anti-laminin antibodies, a marker of the vascular basement membrane. White arrowheads point to distinct examples of microvasculature-associated tumor invasion. (B) Nissl staining of human U251 glioma cells in NU/J mice 72 hpi. Black boxes in each brightfield micrograph outline the field of view shown to the right at increasing magnification. Black arrows in the far right image point to tumor cell bodies heavily stained with Nissl that assume vascular morphology as they migrate away from the main tumor mass. N, tumor necrosis. (C) Fluorescence scanning confocal micrographs of HF2303 primary human GBM cancer stem cells 14 and 143 dpi into the RAG1−/− mouse striatum. Primary human GBM cancer stem cells are immunoreactive for the neural stem cell marker nestin. Brain microvessels have been labeled with anti-CD31 antibodies. White arrowheads indicate several examples of microvasculature-associated tumor invasion. T, bulk tumor mass. (D) Tissue biopsy from a human patient bearing mammary carcinoma metastasis to the brain. The metastatic lesion (purple) seen at low magnification (top left panel) can be seen adjacent to a large superficial blood vessel heavily infiltrated with perivascular tumor cells (white arrowheads). Higher magnification (bottom left panel) of the area outlined by the black box in the panel above reveals the invasive margin of the metastatic lesion. Largest panel to the right shows the invasive margin outlined by the black box in the bottom left image at × 20 magnification. White arrowheads point to several examples of invasive cancer cells (purple) surrounding brain microvessels (seen in red due to the presence of intraluminal red blood cells).
Figure 4
Figure 4
De novo mouse GBM and clinical GBM biopsies exhibit perivascular invasion. (A) De novo mouse GBM generated using the Sleeping Beauty transposase system at 60 days post-plasmid injection. At the center, a 5 × mosaic epifluorescence micrograph of a coronal mouse brain tissue section is shown. Tumor cells have been labeled using anti-nestin antibodies. Brain microvasculature has been labeled with anti–Von Willebrand factor antibodies. 4',-diamidino-2-phenylindole (DAPI) has been used as a counterstain (blue). Numbered white boxes within the central epifluorescence micrograph correspond to respectively numbered higher magnification fluorescence scanning confocal micrographs surrounding it. Several examples of perivascular tissue invasion are indicated by white arrowheads. (B) Human GBM clinical biopsy. A 5 × mosaic epifluorescence micrograph of a tissue biopsy immunolabeled with anti-vimentin antibodies, anti–Von Willebrand factor antibodies, and DAPI (blue) as a counterstain is shown. The zone of transition between tumor tissue (left) and normal brain (right) lies within the white dashed lines overlying each fluorescence channel. Panels below the high-magnification fluorescence scanning confocal micrographs correspond to the dashed white boxes from the epifluorescence images above. White arrowheads in each confocal micrograph point to examples of perivascular tissue invasion.
Figure 5
Figure 5
In silico computational modeling mimics perivascular brain tumor growth. (A) Schematic representation of an agent-based computational model describing perivascular brain tumor growth and invasion. Individual glioma cells move toward nearby blood vessels under the influence of a velocity field vPωiTgxi that mimics the predilection of glioma cells for blood vessels (an underlying assumption of the model). Cells move by a correlated random walk with constant speed toward nearby blood vessels. Once tumor cells make contact with a vessel, they slow their migration speed and proliferate at a rate μb. Tumor cells not associated with a blood vessel eventually undergo cell death at a rate μd and have an average life expectancy of 1/μd. BV, blood vessel. (B) A table summarizing the parameters used in the agent-based model. The respective symbols and optimal values are indicated for each parameter. (C) Representative snapshots of simulated brain tumors corresponding to the three phases of early perivascular tumor growth. The microvasculature domain (vessels only) has been taken from a fluorescence scanning confocal micrograph of RA/EGxdelCre mouse brain microvessels. The simulated tumor initially consists of 1 × 10³ cells centered with the microvasculature domain at t = 0, simulating preinvasive phase I glioma soon after implantation (top right panel). Tumor cells then begin to migrate toward nearby microvessels resulting in a strong correlation between the density of tumor cells and blood vessels, causing the characteristic branch-like morphology of phase II glioma (bottom left panel). Tumor cells making contact with a blood vessel rapidly proliferate and fill the gaps between adjacent blood vessels as the total number of cells grows exponentially. As a result, the tumor center widens and becomes hypercellular while maintaining extensive microvascular contact at the tumor borders in a fashion that mimics phase III glioma (bottom right panel).
Figure 6
Figure 6
Perivascular glioma invasion obviates the requirement for tumor neoangiogenesis to support continual intracranial growth. (A) Representative fluorescence scanning confocal micrographs of GL26-Cit glioma over the initial 144 hpi in the RAG1−/− mouse brain. Mice were treated with non-specific control IgG (top row) or the VEGF-A blocking antibody bevacizumab (bottom row). (B and C) Quantification of time point–matched tumors (n = 30; three tumors per group per time point) reveals no significant difference in overall tumor size as measured by the average tumor area in pixels (B) or morphology as measured by tumor fractal dimension (C) between control IgG– and bevacizumab-treated mice over the 144-hour analysis period. The P value between treatment groups was > .05 at each time point analyzed by two-way analysis of variance followed by Bonferroni post-tests. (D) Immunohistochemistry on GL26-Cit bearing mouse brain tissue sections labeled with the vascular markers CD31 and laminin (cyan) after 144 hours of treatment with control IgG (left) or bevacizumab (right). Solid white tumor outlines in the CD31 channels circumscribe tumor-associated microvasculature and reveal the vessel “normalization” effect in the bevacizumab treatment group. Dashed white boxes outline the area imaged at higher magnification in the two images below each treatment group, further revealing the anatomic detail of vessel preservation in the bevacizumab-treated group. (E) Kaplan-Meier survival analysis of RAG1−/− mice bearing GL26-Cit glioma treated with bevacizumab (n = 5) or control IgG (n = 5). Mantel-Cox log-rank test detected no significant survival difference between the bevacizumab and control IgG treatment groups (P = .3560). (F) Kaplan-Meier survival analysis of RAG1−/− mice bearing endogenous brain tumors generated de novo using the Sleeping Beauty transposase system treated with bevacizumab (n = 9) or control IgG (n = 8). Mantel-Cox log-rank test detected no significant survival difference between the bevacizumab and control IgG treatment groups (P = .5240).
Figure 7
Figure 7
VEGFR-2 blockade with DC101 fails to inhibit tumor growth over 144 hours in vivo or improve survival alone, or as adjuvant therapy. (A) Representative fluorescence scanning confocal micrographs of GL26-Cit tumors in RAG1−/− mice treated with control IgG (top row) or DC101 (bottom row) at a dose of 40 mg/kg delivered i.p. twice weekly over 144 hours (n = 30; three mice per time point per treatment group). No discernable difference in tumor size or morphology is noted at each time point analyzed. (B) Kaplan-Meier survival analysis comparing C57BL/6J mice bearing GL26 gliomas treated with DC101 or control IgG administered three times (red arrows) before (B), or after (C), treatment with Ad-TK/Ad-Flt3L adenovirally mediated cytotoxic gene therapy. Saline treatment alone was used as a negative control. Mantel-Cox log-rank test detected no significant survival difference between Ad-TK/Ad-Flt3L plus DC101 and Ad-TK/Ad-Flt3L plus control IgG treatment either before (P = .8124) or after (P = .5123) treatment with Ad-TK/Ad-Flt3L.
Figure 8
Figure 8
Bevacizumab does not significantly improve the survival of RAG1−/− mice bearing HF2303 primary human GBM stem cells. (A) Kaplan-Meier survival analysis of RAG1−/− mice bearing human HF2303 GBM stem cells treated with bevacizumab or non-specific control IgG. Mantel-Cox log-rank test detected no significant survival difference between the bevacizumab and control IgG treatment groups (P = .0995). Each tick denotes 1 of the 54 total doses of bevacizumab administered throughout the study. n.s., not significant. (B) Representative photographs of gross brain morphology from moribund RAG1−/− mice treated with bevacizumab (left) or control IgG (right) both before (top images) and after (bottom images) sectioning. Note the extensive microvascular hemorrhage associated with tumor neoangiogenesis in the control IgG treatment group, which is completely absent in bevacizumab-treated brain tumors. (C) 5 × mosaic epifluorescence micrographs of coronal brain tissue sections from the mouse brains shown in B. Sections have been immunolabeled with human-specific anti-nestin antibodies to label tumor cells, anti-CD31 antibodies to label brain microvasculature, and DAPI as a counterstain to label nuclei (blue). Note that the contralateral striatum in the control IgG treatment group (denoted as St.; dashed white outlines) appears compressed, presumably due to nodular tumor growth while bevacizumab treatment induces massive invasion into the contralateral hemisphere. Dashed white boxes in the respective images correspond to high-magnification fluorescence scanning confocal micrographs shown below. Normalized tumor vascular is specifically seen in bevacizumab-treated human HF2303 tumors, while control IgG–treated brain tumors are characterized by extensive microvessel fragmentation.
Figure 9
Figure 9
Quantification of brain microvascular network density. (A) Microvessels within the C57BL/6J tumor-naïve striatum were immunolabeled with anti-CD31, anti-laminin (cyan), and anti–α-SMA vascular markers and display a calculated average intervessel distance (AIVDcalc) of 56.95 ± 17.2 μm. (B) Microvessels within the RA/EGxdelCre tumor-naïve striatum showing an AIVDcalc of 56.29 ± 14.7 μm, in good agreement with the values obtained in A, indicating a low degree of variability in this parameter between different mouse strains. (C) Analysis of invasive GL26-Cit glioma cells at various time points at the infiltrative tumor margin within the RA/EGxdelCre mouse striatum (microvessels shown in red). Composite images (top row) show close vascular contacts made by individual tumor cells at each time point analyzed (white arrows). Individual fluorescence channels (middle and bottom rows) show AIVDcalc and calculated average tumor cell diameters (ACDcalc) for the respective micrographs. Overall averages for AIVDcalc and ACDcalc were determined to be 49.99 and 21.45 μm, respectively. (D) Low-magnification fluorescence scanning confocal micrograph of striatal microvasculature in the tumor-naïve RA/EGxdelCre brain. The blue circle illustrates the large number of brain microvessels present within a sphere of 1 mm3, a volume below which many solid tumors are thought togrow avascularly (here, we assume that microvessel density does not change significantly ± 1 mm in the Z direction). The radius of the circle has been calculated by solving for r=3mm3/4π3 in the equation for the volume of a sphere measuring 1 mm3 (upper right corner). The white arrow indicates the radius (r = 0.6205 mm) of the 1-mm3 sphere. The combination of high microvessel density and perivascular tumor invasion is predicted to preclude an avascular phase of brain tumor growth.
Figure 10
Figure 10
Brain tumor autovascularization. (A) Schematic representation of a coronally sectioned mouse brain revealing perivascular glioma growth and invasion within the striatum. Individual glioma cells are shown in green with blue nuclei. The tumor mass is vascularized with preexisting brain microvessels due to invasive glioma cells entering perivascular channels at the tumor border. Brain microvasculature is classified as arterial or venule (blue). Arterials are further characterized by the presence of smooth muscle (green bands) around larger diameter vessels, while the venous system is covered by patchwork pericytes (green amoeboid cells) as observed empirically using vascular-specific antibodies in situ (see Figure S7). No predilection for invasive glioma cells to migrate in association with arterials versus venules is observed. (B and C) Detailed views of invasive (B) and central (C) portions of perivascular brain tumors. White boxes shown in A correspond to the respective regions in B and C. (B) Illustration of brain perivascular potential space being infiltrated by invasive glioma cells. Adjacent microvessels have an average intervessel distance (AIVD) of ~ 50 μm (red scale bar), while the average tumor cell diameter (ACD) measures ~ 20 μm (green scale bar) as calculated empirically. Dashed white arrows represent the small intervening distance separating adjacent microvessels at the level of the capillary plexus. (C) Illustration of glioma cell division within the perivascular space. Glioma cell division within the perivascular space causes the displacement of normal brain tissue (i.e., neuropil, NP) between adjacent microvessels. The intervening space is then replaced by tumor cells while preexisting brain microvessels simultaneously become trapped within the growing tumor mass. Iterations of tumor cell invasion and division within the perivascular space causes further engulfment of preexisting brain microvessels, leading well-vascularized tumors early in tumor development through a neoangiogenesis-independent process we refer to as “autovascularization”. (D) Details of the microanatomic arrangement at the tumor-vessel interface based on empirical observations.

References

    1. Dolecek TA, Propp JM, Stroup NE, Kruchko C. CBTRUS statistical report: primary brain and central nervous system tumors diagnosed in the United States in 2005–2009. Neuro Oncol. 2012;14(Suppl 5):v1–v49. - PMC - PubMed
    1. Grossman SA, Ye X, Piantadosi S, Desideri S, Nabors LB, Rosenfeld M, Fisher J. Survival of patients with newly diagnosed glioblastoma treated with radiation and temozolomide in research studies in the United States. Clin Cancer Res. 2010;16:2443–2449. - PMC - PubMed
    1. Scherer HJ. The forms of growth in gliomas and their practical significance. Brain. 1940;63:1–35.
    1. Scherer HJ. Structural development in gliomas. Am J Cancer. 1938;34:333–351.
    1. Winkler F, Kienast Y, Fuhrmann M, Von Baumgarten L, Burgold S, Mitteregger G, Kretzschmar H, Herms J. Imaging glioma cell invasion in vivo reveals mechanisms of dissemination and peritumoral angiogenesis. Glia. 2009;57:1306–1315. - PubMed

Publication types

MeSH terms

Substances