

Co-treatment with panitumumab and trastuzumab augments response to the MEK inhibitor trametinib in a patient-derived xenograft model of pancreatic cancer
- PMID: 25117978
- PMCID: PMC4198828
- DOI: 10.1016/j.neo.2014.06.004
Co-treatment with panitumumab and trastuzumab augments response to the MEK inhibitor trametinib in a patient-derived xenograft model of pancreatic cancer
Abstract
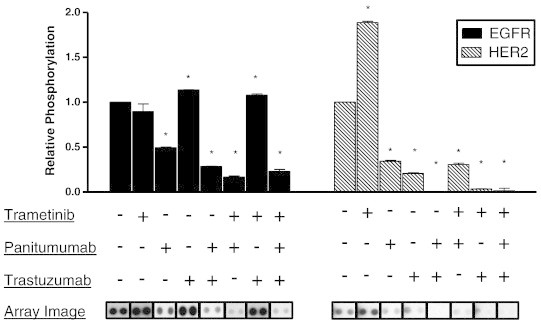
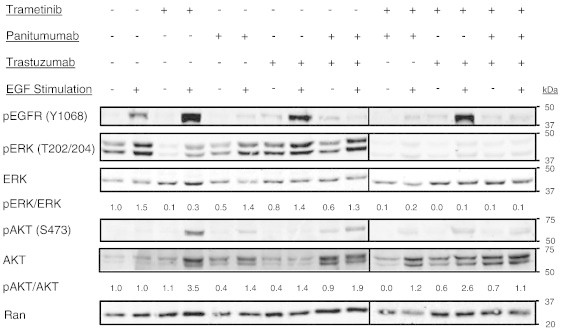
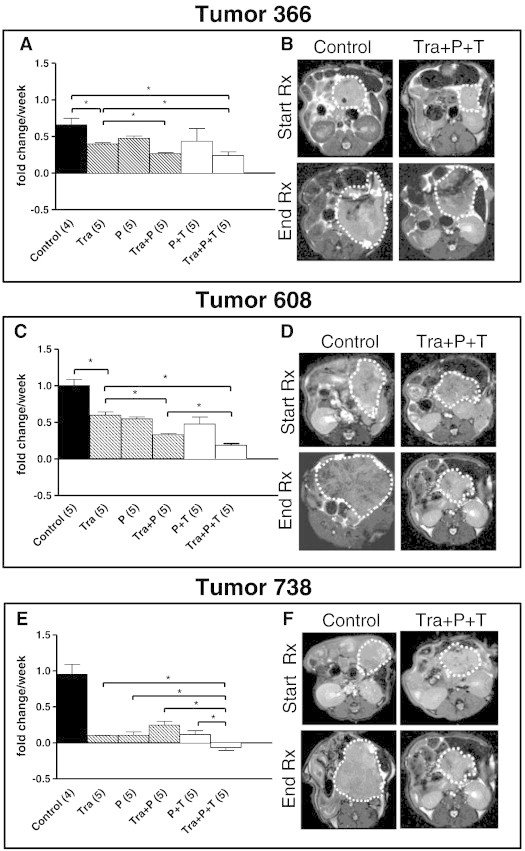
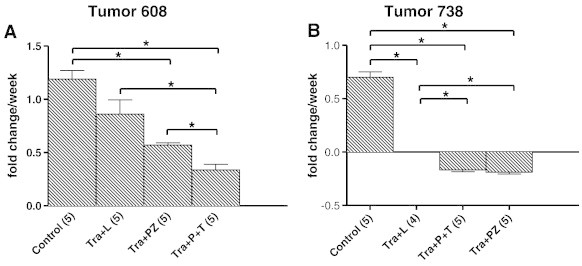
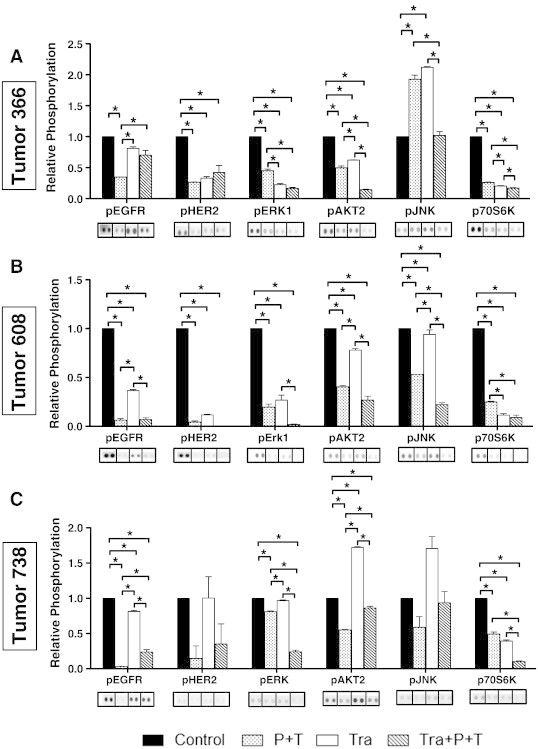
Kirsten rat sarcoma viral oncogene homolog (KRAS) mutations and epidermal growth factor receptor (EGFR) family signaling are drivers of tumorigenesis in pancreatic ductal adenocarcinoma (PDAC). Previous studies have demonstrated that combinatorial treatment of PDAC xenografts with the mitogen-activated protein kinase-extracellular-signal-regulated kinase (ERK) kinase1/2 (MEK1/2) inhibitor trametinib and the dual EGFR/human epidermal growth factor receptor 2 (HER2) inhibitor lapatinib provided more effective inhibition than either treatment alone. In this study, we have used the therapeutic antibodies, panitumumab (specific for EGFR) and trastuzumab (specific for HER2), to probe the role of EGFR and HER2 signaling in the proliferation of patient-derived xenograft (PDX) tumors. We show that dual anti-EGFR and anti-HER2 therapy significantly augmented the growth inhibitory effects of the MEK1/2 inhibitor trametinib in three different PDX tumors. While significant growth inhibition was observed in both KRAS mutant xenograft groups receiving trametinib and dual antibody therapy (tumors 366 and 608), tumor regression was observed in the KRAS wild-type xenografts (tumor 738) treated in the same manner. Dual antibody therapy in conjunction with trametinib was equally or more effective at inhibiting tumor growth and with lower apparent toxicity than trametinib plus lapatinib. Together, these studies provide further support for a role for EGFR and HER2 in pancreatic cancer proliferation and underscore the importance of therapeutic intervention in both the KRAS-rapidly accelerated fibrosarcoma kinase (RAF)-MEK-ERK and EGFR-HER2 pathways to achieve maximal therapeutic efficacy in patients.
Copyright © 2014 Neoplasia Press, Inc. Published by Elsevier Inc. All rights reserved.
Figures
Similar articles
-
Inhibition of the growth of patient-derived pancreatic cancer xenografts with the MEK inhibitor trametinib is augmented by combined treatment with the epidermal growth factor receptor/HER2 inhibitor lapatinib.Neoplasia. 2013 Feb;15(2):143-55. doi: 10.1593/neo.121712. Neoplasia. 2013. PMID: 23441129 Free PMC article.
-
A novel regimen for pancreatic ductal adenocarcinoma targeting MEK, BCL-xL, and EGFR.Neoplasia. 2025 Jan;59:101070. doi: 10.1016/j.neo.2024.101070. Epub 2024 Nov 14. Neoplasia. 2025. PMID: 39541736 Free PMC article.
-
In pancreatic carcinoma, dual EGFR/HER2 targeting with cetuximab/trastuzumab is more effective than treatment with trastuzumab/erlotinib or lapatinib alone: implication of receptors' down-regulation and dimers' disruption.Neoplasia. 2012 Feb;14(2):121-30. doi: 10.1593/neo.111602. Neoplasia. 2012. PMID: 22431920 Free PMC article.
-
EGFR as a potential target for the treatment of pancreatic cancer: dilemma and controversies.Curr Drug Targets. 2014;15(14):1293-301. doi: 10.2174/1389450115666141125123003. Curr Drug Targets. 2014. PMID: 25429712 Review.
-
Inhibition of the RAF/MEK/ERK Signaling Cascade in Pancreatic Cancer: Recent Advances and Future Perspectives.Int J Mol Sci. 2024 Jan 28;25(3):1631. doi: 10.3390/ijms25031631. Int J Mol Sci. 2024. PMID: 38338909 Free PMC article. Review.
Cited by
-
PRMT5 Identified as a Viable Target for Combination Therapy in Preclinical Models of Pancreatic Cancer.Biomolecules. 2025 Jun 30;15(7):948. doi: 10.3390/biom15070948. Biomolecules. 2025. PMID: 40723820 Free PMC article.
-
Pancreatic Cancer: Molecular Characterization, Clonal Evolution and Cancer Stem Cells.Biomedicines. 2017 Nov 18;5(4):65. doi: 10.3390/biomedicines5040065. Biomedicines. 2017. PMID: 29156578 Free PMC article. Review.
-
Patient-Derived Tumor Xenografts Are Susceptible to Formation of Human Lymphocytic Tumors.Neoplasia. 2015 Sep;17(9):735-741. doi: 10.1016/j.neo.2015.09.004. Neoplasia. 2015. PMID: 26476081 Free PMC article.
-
CRISPR knockout screening identifies combinatorial drug targets in pancreatic cancer and models cellular drug response.Nat Commun. 2018 Oct 15;9(1):4275. doi: 10.1038/s41467-018-06676-2. Nat Commun. 2018. PMID: 30323222 Free PMC article.
-
Dual anti-HER2/EGFR inhibition synergistically increases therapeutic effects and alters tumor oxygenation in HNSCC.Sci Rep. 2024 Feb 14;14(1):3771. doi: 10.1038/s41598-024-52897-5. Sci Rep. 2024. PMID: 38355949 Free PMC article.
References
-
- Li D, Xie K, Wolff R, Abbruzzese JL. Pancreatic cancer. Lancet. 2004;363:1049–1057. - PubMed
-
- Smith BD, Smith GL, Hurria A, Hortobagyi GN, Buchholz TA. Future of cancer incidence in the United States: burdens upon an aging, changing nation. J Clin Oncol. 2009;27:2758–2765. - PubMed
-
- Furukawa T. Molecular pathology of pancreatic cancer: implications for molecular targeting therapy. Clin Gastroenterol Hepatol. 2009;7:S35–S39. - PubMed
-
- Hidalgo M. Pancreatic cancer. N Engl J Med. 2010;362:1605–1617. - PubMed
MeSH terms
Substances
Grants and funding
LinkOut - more resources
Full Text Sources
Other Literature Sources
Medical
Molecular Biology Databases
Research Materials
Miscellaneous
