

Using latent class analysis to develop a model of the relationship between socioeconomic position and ethnicity: cross-sectional analyses from a multi-ethnic birth cohort study
- PMID: 25118003
- PMCID: PMC4141955
- DOI: 10.1186/1471-2458-14-835
Using latent class analysis to develop a model of the relationship between socioeconomic position and ethnicity: cross-sectional analyses from a multi-ethnic birth cohort study
Abstract
Background: Almost all studies in health research control or investigate socioeconomic position (SEP) as exposure or confounder. Different measures of SEP capture different aspects of the underlying construct, so efficient methodologies to combine them are needed. SEP and ethnicity are strongly associated, however not all measures of SEP may be appropriate for all ethnic groups.
Methods: We used latent class analysis (LCA) to define subgroups of women with similar SEP profiles using 19 measures of SEP. Data from 11,326 women were used, from eight different ethnic groups but with the majority from White British (40%) or Pakistani (45%) backgrounds, who were recruited during pregnancy to the Born in Bradford birth cohort study.
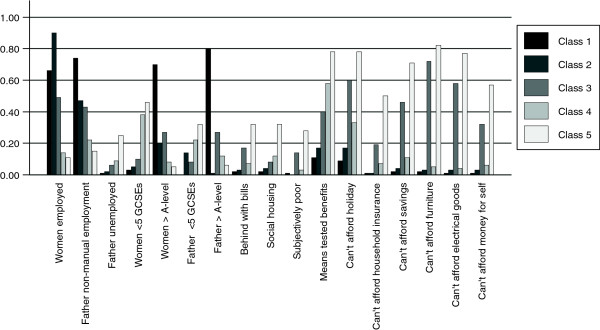
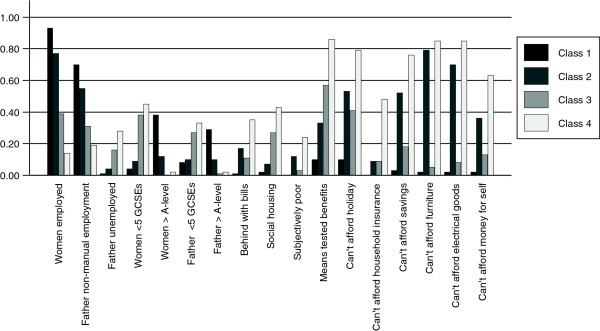
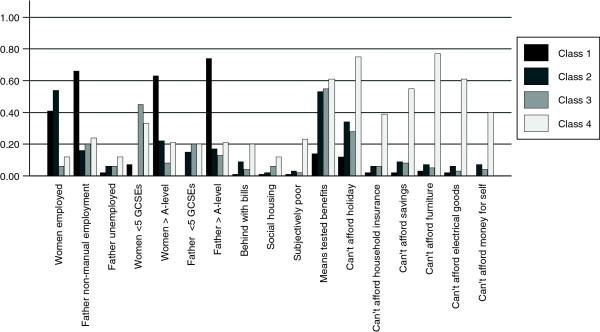
Results: Five distinct SEP subclasses were identified in the LCA: (i) "Least socioeconomically deprived and most educated" (20%); (ii) "Employed and not materially deprived" (19%); (iii) "Employed and no access to money" (16%); (iv) "Benefits and not materially deprived" (29%) and (v) "Most economically deprived" (16%). Based on the magnitude of the point estimates, the strongest associations were that compared to White British women, Pakistani and Bangladeshi women were more likely to belong to groups: (iv) "benefits and not materially deprived" (relative risk ratio (95% CI): 5.24 (4.44, 6.19) and 3.44 (2.37, 5.00), respectively) or (v) most deprived group (2.36 (1.96, 2.84) and 3.35 (2.21, 5.06) respectively) compared to the least deprived class. White Other women were more than twice as likely to be in the (iv) "benefits and not materially deprived group" compared to White British women and all ethnic groups, other than the Mixed group, were less likely to be in the (iii) "employed and not materially deprived" group than White British women.
Conclusions: LCA allows different aspects of an individual's SEP to be considered in one multidimensional indicator, which can then be integrated in epidemiological analyses. Ethnicity is strongly associated with these identified subgroups. Findings from this study suggest a careful use of SEP measures in health research, especially when looking at different ethnic groups. Further replication of these findings is needed in other populations.
Figures
Similar articles
-
Cross-sectional study of ethnic differences in the utility of area deprivation measures to target socioeconomically deprived individuals.Soc Sci Med. 2013 May;85:27-31. doi: 10.1016/j.socscimed.2013.02.025. Epub 2013 Feb 27. Soc Sci Med. 2013. PMID: 23540362
-
Socioeconomic inequalities in adult oral health across different ethnic groups in England.Health Qual Life Outcomes. 2019 May 17;17(1):85. doi: 10.1186/s12955-019-1156-3. Health Qual Life Outcomes. 2019. PMID: 31101052 Free PMC article.
-
Differences in socioeconomic position, lifestyle and health-related pregnancy characteristics between Pakistani and White British women in the Born in Bradford prospective cohort study: the influence of the woman's, her partner's and their parents' place of birth.BMJ Open. 2014 Jun 19;4(6):e004805. doi: 10.1136/bmjopen-2014-004805. BMJ Open. 2014. PMID: 24948746 Free PMC article.
-
Is ethnic density associated with health in a context of social disadvantage? Findings from the Born in Bradford cohort.Ethn Health. 2016;21(2):196-213. doi: 10.1080/13557858.2015.1047742. Epub 2015 Jul 14. Ethn Health. 2016. PMID: 26169185
-
Folic acid supplementation and malaria susceptibility and severity among people taking antifolate antimalarial drugs in endemic areas.Cochrane Database Syst Rev. 2022 Feb 1;2(2022):CD014217. doi: 10.1002/14651858.CD014217. Cochrane Database Syst Rev. 2022. PMID: 36321557 Free PMC article.
Cited by
-
Do executive functions and processing speed mediate the relationship between socioeconomic status and educational achievement? Analysis of an observational birth cohort study.BMC Psychol. 2024 Dec 18;12(1):746. doi: 10.1186/s40359-024-02243-1. BMC Psychol. 2024. PMID: 39696624 Free PMC article.
-
A Latent Class Analysis of Perceived Neighborhood Conditions Associated with Mental Disorders Among Children in the United States.Child Psychiatry Hum Dev. 2021 Jun;52(3):355-364. doi: 10.1007/s10578-020-01020-6. Child Psychiatry Hum Dev. 2021. PMID: 32632829
-
Factors predicting amoxicillin prescribing in primary care among children: a cohort study.Br J Gen Pract. 2022 Apr 4;72(722):e659-67. doi: 10.3399/BJGP.2021.0639. Online ahead of print. Br J Gen Pract. 2022. PMID: 35817584 Free PMC article.
-
Associations of diarised sleep onset time, period and duration with total and central adiposity in a biethnic sample of young children: the Born in Bradford observational cohort study.BMJ Open. 2021 May 25;11(5):e044769. doi: 10.1136/bmjopen-2020-044769. BMJ Open. 2021. PMID: 34035099 Free PMC article.
-
Determinants of gestational weight gain during pregnancy in a multiethnic UK-based population: Findings from the Born in Bradford cohort study.PLoS One. 2025 May 23;20(5):e0323278. doi: 10.1371/journal.pone.0323278. eCollection 2025. PLoS One. 2025. PMID: 40408360 Free PMC article.
References
-
- Howe LD, Galobardes B, Matijasevich A, Gordon D, Johnston D, Onwujekwe O, Patel R, Webb EA, Lawlor DA, Hargreaves JR. Measuring socio-economic position for epidemiological studies in low- and middle-income countries: a methods of measurement in epidemiology paper. Int J Epidemiol. 2012;41(3):871–886. doi: 10.1093/ije/dys037. - DOI - PMC - PubMed
Pre-publication history
-
- The pre-publication history for this paper can be accessed here:http://www.biomedcentral.com/1471-2458/14/835/prepub
Publication types
MeSH terms
Grants and funding
LinkOut - more resources
Full Text Sources
Other Literature Sources
Medical
Research Materials
