

Mitochondrial haplogroups are associated with severity of diabetic retinopathy
- PMID: 25118268
- PMCID: PMC4160073
- DOI: 10.1167/iovs.14-15149
Mitochondrial haplogroups are associated with severity of diabetic retinopathy
Abstract
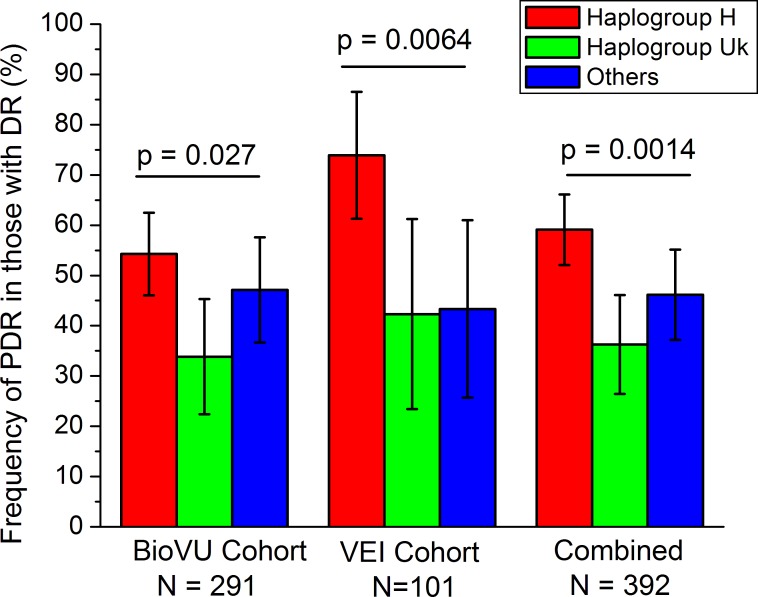
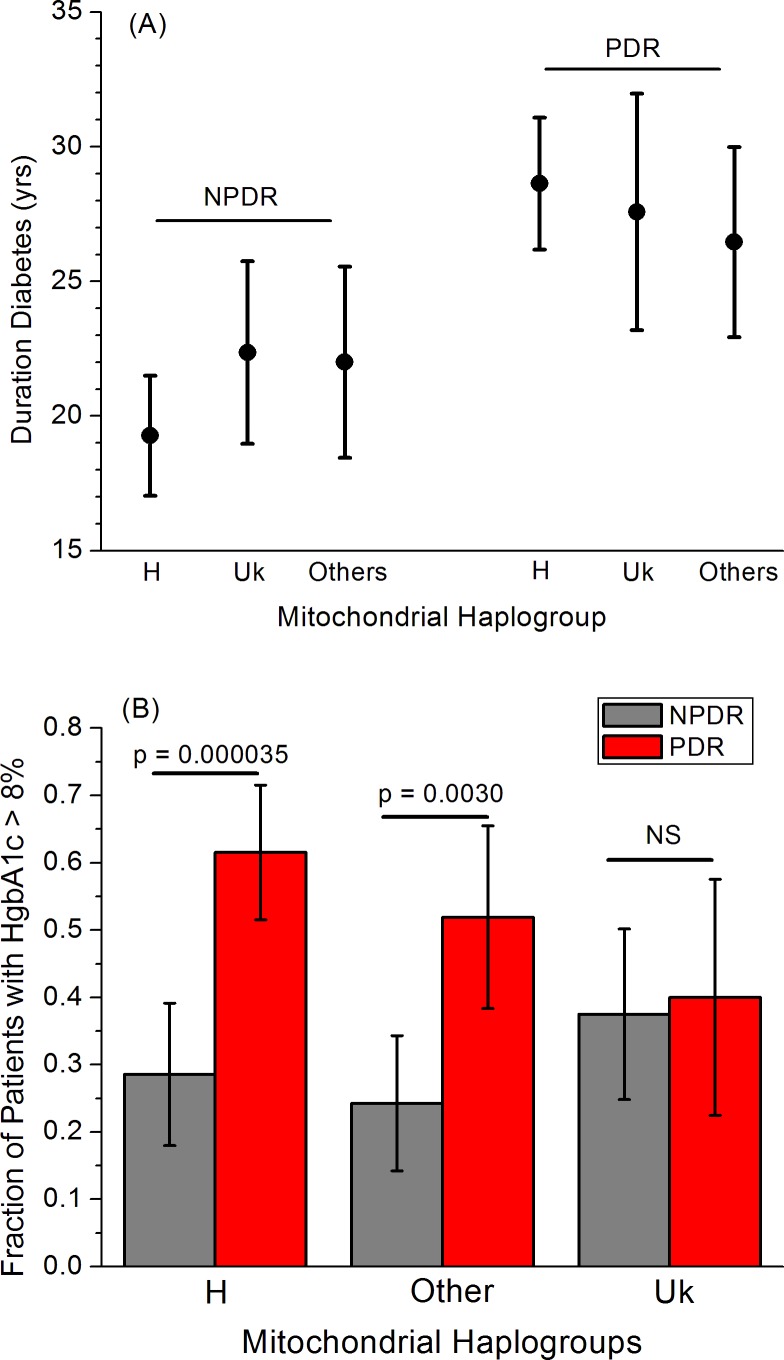
Purpose: To determine if specific mitochondrial haplogroups associate with nonproliferative diabetic retinopathy (NPDR) and proliferative diabetic retinopathy (PDR).
Methods: Deidentified medical records for Caucasian patients with diabetic retinopathy (DR; 153 NPDR and 138 PDR) were obtained from BioVU, Vanderbilt University's electronic, deidentified DNA databank. An independent cohort of Caucasian patients with DR (44 NPDR and 57 PDR) from the Vanderbilt Eye Institute (VEI) was used for validation. We tested for an association between mitochondrial haplogroups and PDR among patients with DR.
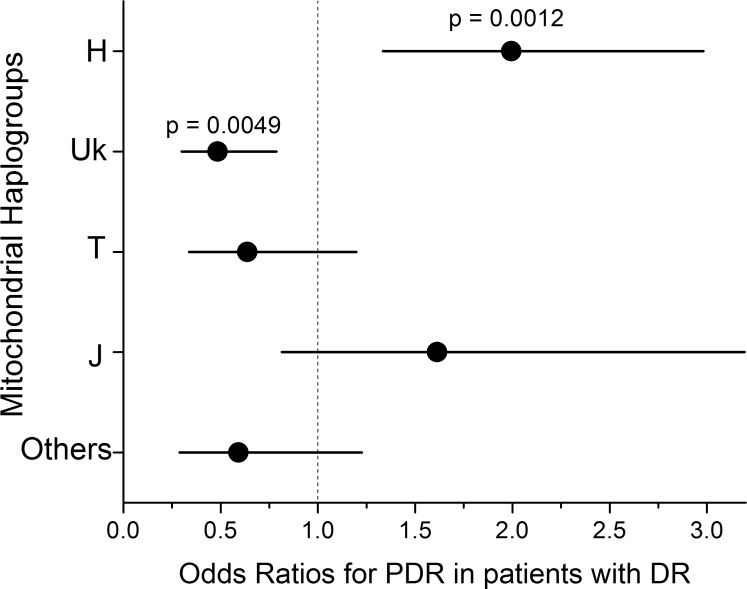
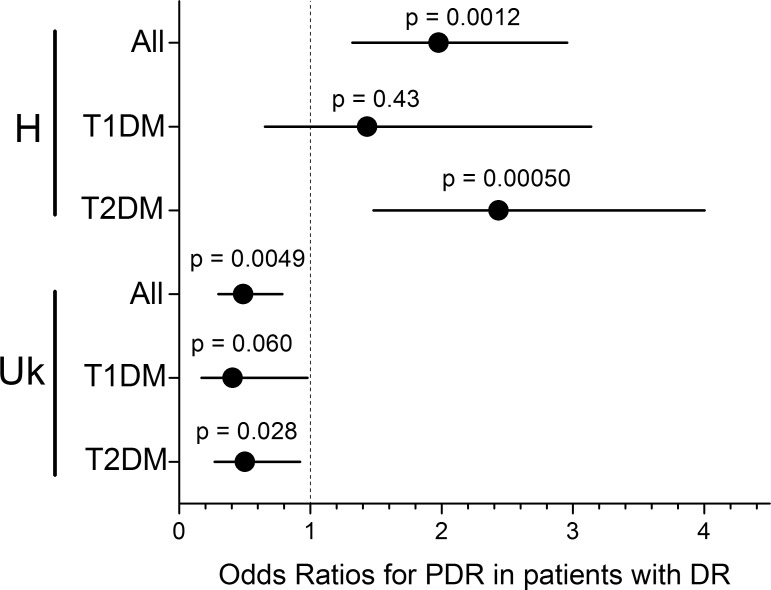
Results: In the BioVU cohort, PDR frequency among Caucasian DR patients differed significantly by mitochondrial haplogroup (P = 0.027). Replication in the VEI cohort confirmed this association (P = 0.0064). In the combined cohort, patients from the common haplogroup H were more likely to have PDR (odds ratio [OR] = 2.0 [95% confidence interval (CI) = 1.3-3.0], P = 0.0012), while patients from haplogroup Uk were less likely to have PDR (OR = 0.5 [95% CI = 0.3-0.8], P = 0.0049). In logistic regression analyses, the addition of diabetes duration, hemoglobin A1c (HgbA1c) levels, and hypertension had no effect on the associations of haplogroups H and Uk with PDR.
Conclusions: In this study, DR patients from mitochondrial haplogroup H were more likely to have PDR, while DR patients from haplogroup Uk were less likely to have PDR. The association was independent of the major clinical variables affecting PDR. The mitochondrial haplogroups were as strong a risk factor for PDR as were elevated HgbA1c levels.
Keywords: diabetes; diabetic retinopathy; genetics; mitochondrial DNA; mitochondrial genetics; mitochondrial haplogroup; proliferative diabetic retinopathy.
Copyright 2014 The Association for Research in Vision and Ophthalmology, Inc.
Figures
References
-
- Fong DS, Aiello L, Gardner TW, et al. Retinopathy in diabetes. Diabetes Care. 2004; 27 (suppl 1): S84–S87 - PubMed
-
- Kempen JH, O'Colmain BJ, Leske MC, et al. The prevalence of diabetic retinopathy among adults in the United States. Arch Ophthalmol. 2004; 122: 552–563 - PubMed
-
- Cheung N, Mitchell P, Wong TY. Diabetic retinopathy. Lancet. 2010; 376: 124–136 - PubMed
-
- Antonetti DA, Klein R, Gardner TW. Diabetic retinopathy. N Engl J Med. 2012; 366: 1227–1239 - PubMed
Publication types
MeSH terms
Substances
Grants and funding
LinkOut - more resources
Full Text Sources
Other Literature Sources
Medical
