

Homogeneity of antimicrobial policy, yet heterogeneity of antimicrobial resistance: antimicrobial non-susceptibility among 108,717 clinical isolates from primary, secondary and tertiary care patients in London
- PMID: 25118270
- PMCID: PMC4228780
- DOI: 10.1093/jac/dku307
Homogeneity of antimicrobial policy, yet heterogeneity of antimicrobial resistance: antimicrobial non-susceptibility among 108,717 clinical isolates from primary, secondary and tertiary care patients in London
Abstract
Objectives: We examined the 4 year trend in antimicrobial susceptibilities and prescribing across levels of care at two London teaching hospitals and their multisite renal unit, and for the surrounding community.
Methods: Laboratory and pharmacy information management systems were interrogated, with antimicrobial use and susceptibilities analysed between hospitals, within hospitals and over time.
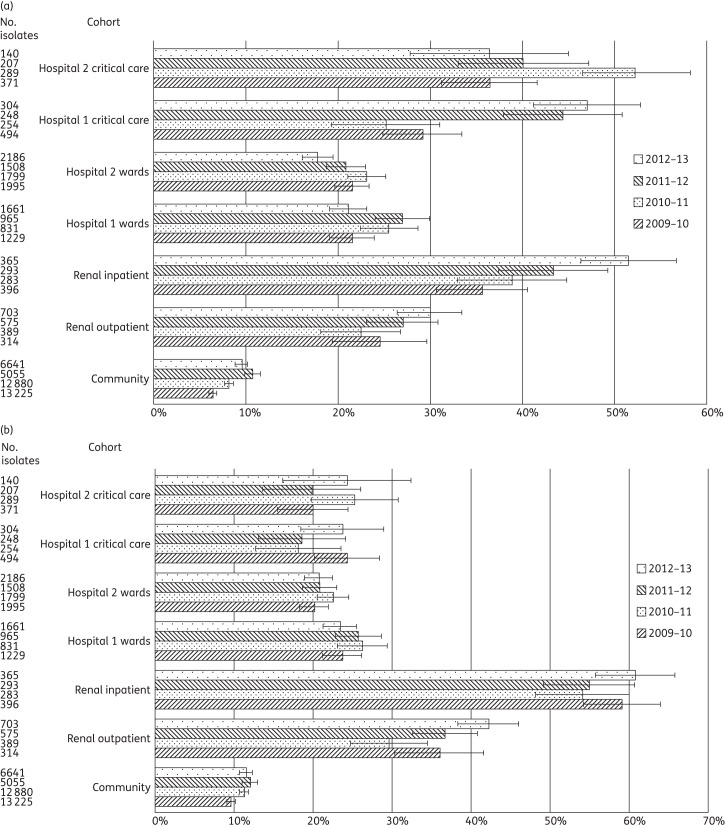
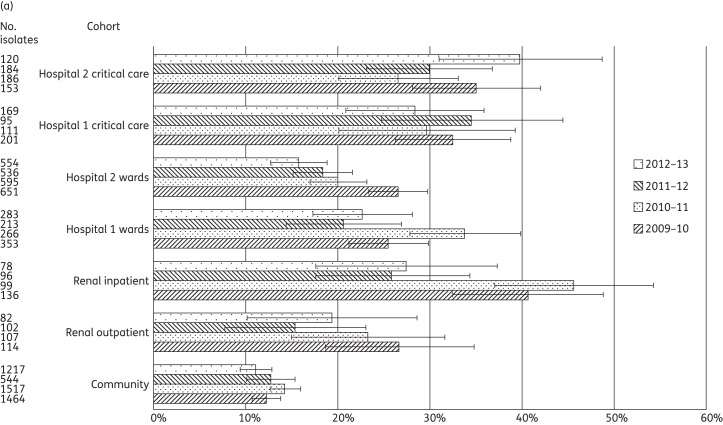
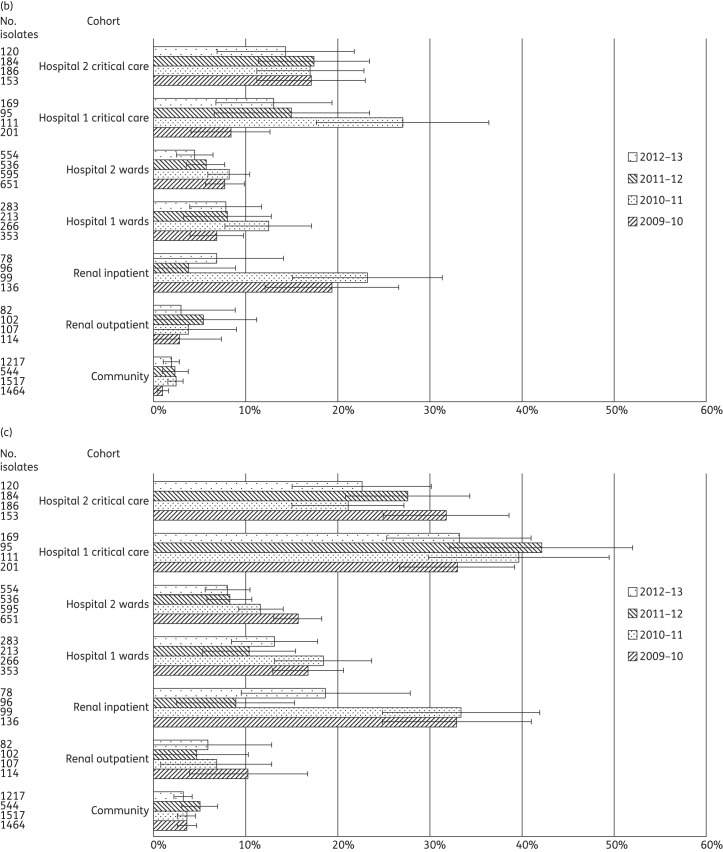
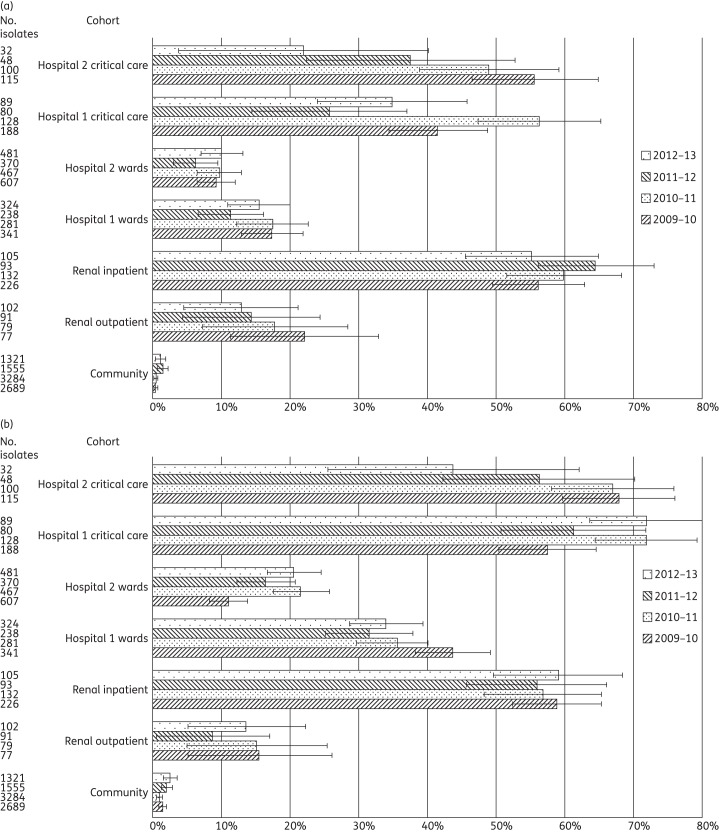
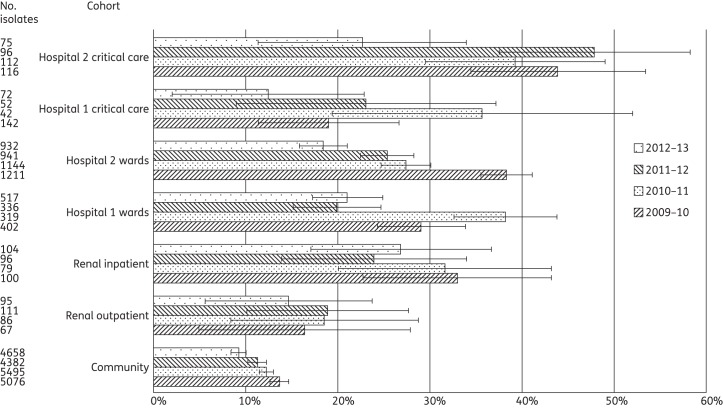
Results: A total of 108,717 isolates from 71,687 patients were identified, with significant differences (at P < 0.05) in antimicrobial susceptibility between and within hospitals. Across the 4 years, rates of ESBL-/AmpC-producing Enterobacteriaceae ranged from 6.4% to 10.7% among community isolates, 17.8% to 26.9% at ward level and 25.2% to 52.5% in critical care. Significant variations were also demonstrated in glycopeptide-resistant enterococci (ward level 6.2%-17.4%; critical care 21.9%-56.3%), MRSA (ward level 18.5%-38.2%; critical care 12.5%-47.9%) and carbapenem-resistant Pseudomonas spp. (ward level 8.3%-16.9%; critical care 19.9%-53.7%). Few instances of persistently higher resistance were seen between the hospitals in equivalent cohorts, despite persistently higher antimicrobial use in Hospital 1 than Hospital 2. We found significant fluctuations in non-susceptibility year on year across the cohorts, but with few persistent trends.
Conclusions: The marked heterogeneity of antimicrobial susceptibilities between hospitals, within hospitals and over time demands detailed, standardized surveillance and appropriate benchmarking to identify possible drivers and effective interventions. Homogeneous antimicrobial policies are unlikely to continue to be suitable as individual hospitals join hospital networks, and policies should be tailored to local resistance rates, at least at the hospital level, and possibly with finer resolution, particularly for critical care.
Keywords: antibiograms; antimicrobial stewardship; healthcare-associated infections; multidrug-resistant organisms.
© The Author 2014. Published by Oxford University Press on behalf of the British Society for Antimicrobial Chemotherapy.
Figures
References
-
- ECDC. Antimicrobial Resistance Surveillance in Europe 2011. http://www.ecdc.europa.eu/en/publications/publications/antimicrobial-res... .
-
- Lamoth F, Wenger A, Prod'hom G, et al. Comparison of hospital-wide and unit-specific cumulative antibiograms in hospital- and community-acquired infection. Infection. 2010;38:249–53. - PubMed
-
- Azim A, Dwivedi M, Rao PB, et al. Epidemiology of bacterial colonization at intensive care unit admission with emphasis on extended-spectrum β-lactamase- and metallo-β-lactamase-producing Gram-negative bacteria—an Indian experience. J Med Microbiol. 2010;59:955–60. - PubMed
-
- Verhamme KMC, De Coster W, De Roo L, et al. Pathogens in early-onset and late-onset intensive care unit-acquired pneumonia. Infect Control Hosp Epidemiol. 2007;28:389–97. - PubMed
-
- Reynolds R, Maher K, Hope R on behalf of BSAC Working Party on Resistance Surveillance. ICU—always the hotbed of resistance? Clin Microbiol Infect. 2011;17(Suppl S4):S333 (P1231).
Publication types
MeSH terms
Substances
Grants and funding
LinkOut - more resources
Full Text Sources
Other Literature Sources
Medical
Miscellaneous
