

Expression of macrophage migration inhibitory factor in the mouse neocortex and posterior piriform cortices during postnatal development
- PMID: 25118614
- PMCID: PMC11488965
- DOI: 10.1007/s10571-014-0094-1
Expression of macrophage migration inhibitory factor in the mouse neocortex and posterior piriform cortices during postnatal development
Abstract
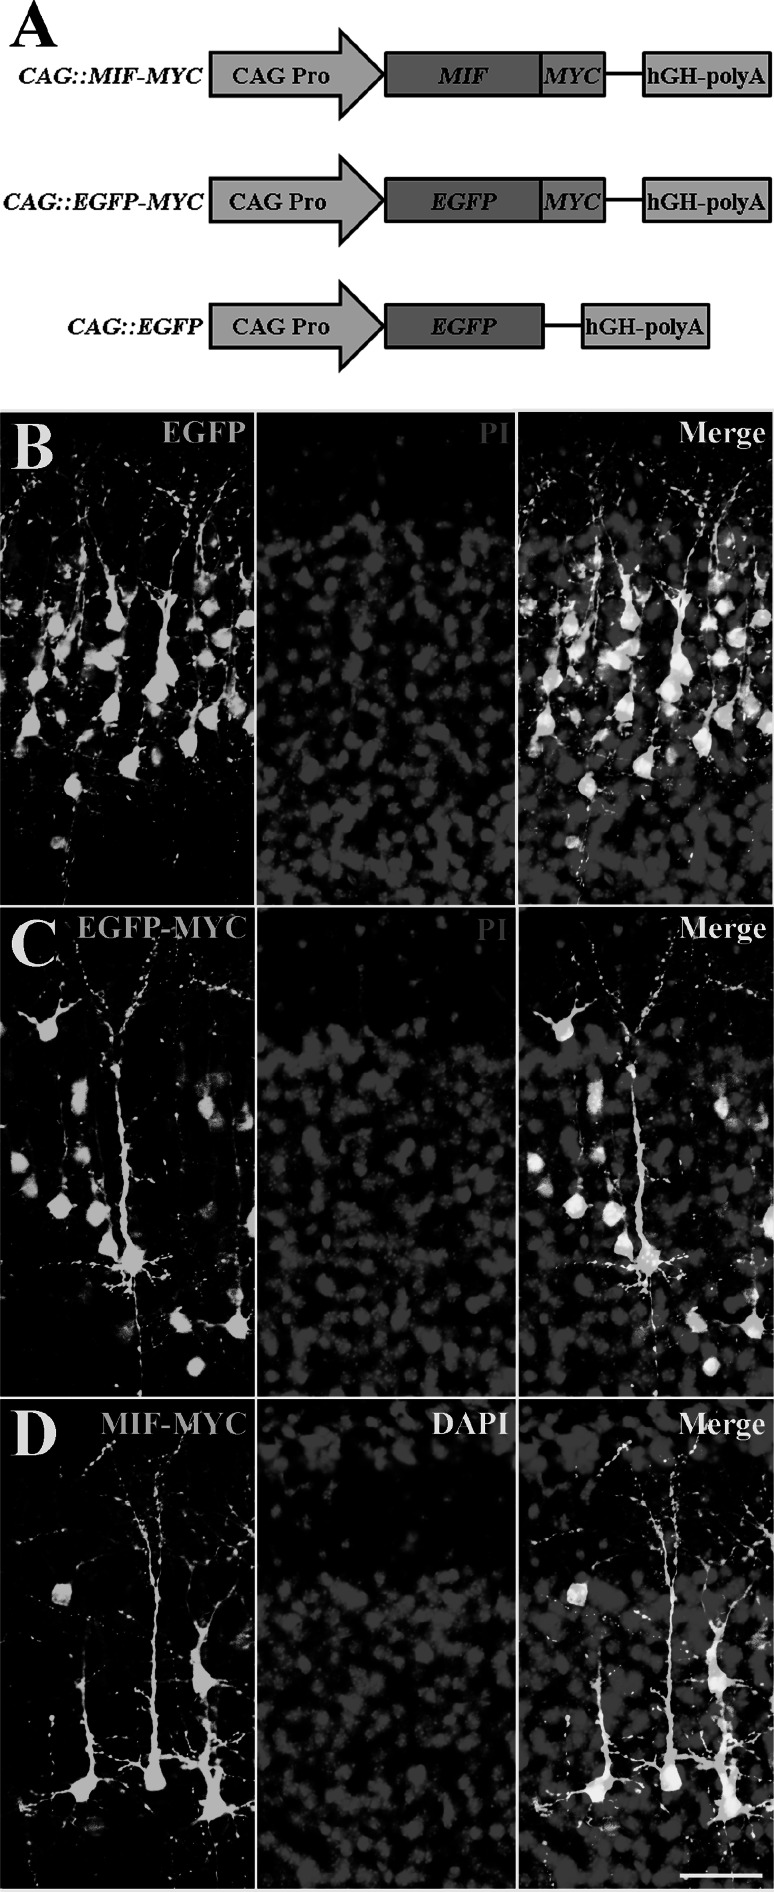
Macrophage migration inhibitory factor (MIF) functions as a pleiotropic protein, participating in a vast array of cellular and biological processes. Abnormal expression of MIF has been implicated in many neurological diseases, including Parkinson's disease, epilepsy, Alzheimer's Disease, stroke, and neuropathic pain. However, the expression patterns of mif transcript and MIF protein from the early postnatal period through adulthood in the mouse brain are still poorly understood. We therefore investigated the temporal and spatial expression of MIF in the mouse neocortex during postnatal development in detail and partially in posterior piriform cortices (pPC). As determined by quantitative real-time PCR (qPCR), mif transcript gradually increased during development, with the highest level noted at postnatal day 30 (P30) followed by a sharp decline at P75. In contrast, Western blotting results showed that MIF increased constantly from P7 to P75. The highest level of MIF was at P75, while the lowest level of MIF was at P7. Immunofluorescence histochemistry revealed that MIF-immunoreactive (ir) cells were within the entire depth of the developed neocortex, and MIF was heterogeneously distributed among cortical cells, especially at P7, P14, P30, and P75; MIF was abundant in the pyramidal layer within pPC. Double immunostaining showed that all the mature neurons were MIF-ir and all the intensely stained MIF-ir cells were parvalbumin positive (Pv +) at adult. Moreover, it was demonstrated that MIF protein localized in the perikaryon, processes, presynaptic structures, and the nucleus in neurons. Taken together, the developmentally regulated expression and the subcellular localization of MIF should form a platform for an analysis of MIF neurodevelopmental biology and MIF-related nerve diseases.
Conflict of interest statement
None.
Figures


Similar articles
-
Expression and glucocorticoid regulation of macrophage migration inhibitory factor (MIF) in hippocampal and neocortical rat brain cells in culture.Brain Res. 2000 Jun 30;869(1-2):25-30. doi: 10.1016/s0006-8993(00)02336-2. Brain Res. 2000. PMID: 10865055
-
Temporal Differences in Interneuron Invasion of Neocortex and Piriform Cortex during Mouse Cortical Development.Cereb Cortex. 2020 May 14;30(5):3015-3029. doi: 10.1093/cercor/bhz291. Cereb Cortex. 2020. PMID: 31838488
-
Developmental Markers Expressed in Neocortical Layers Are Differentially Exhibited in Olfactory Cortex.PLoS One. 2015 Sep 25;10(9):e0138541. doi: 10.1371/journal.pone.0138541. eCollection 2015. PLoS One. 2015. PMID: 26407299 Free PMC article.
-
Synaptic and extrasynaptic location of the receptor tyrosine kinase met during postnatal development in the mouse neocortex and hippocampus.J Comp Neurol. 2013 Oct 1;521(14):3241-59. doi: 10.1002/cne.23343. J Comp Neurol. 2013. PMID: 23787772 Free PMC article.
-
Macrophage migration inhibitory factor: A multifaceted cytokine implicated in multiple neurological diseases.Exp Neurol. 2018 Mar;301(Pt B):83-91. doi: 10.1016/j.expneurol.2017.06.021. Epub 2017 Jul 2. Exp Neurol. 2018. PMID: 28679106 Review.
Cited by
-
Profile of MIF in Developing Hippocampus: Association With Cell Proliferation and Neurite Outgrowth.Front Mol Neurosci. 2020 Aug 12;13:147. doi: 10.3389/fnmol.2020.00147. eCollection 2020. Front Mol Neurosci. 2020. PMID: 32903462 Free PMC article.
-
Macrophage migration inhibitory factor (MIF) modulates trophic signaling through interaction with serine protease HTRA1.Cell Mol Life Sci. 2017 Dec;74(24):4561-4572. doi: 10.1007/s00018-017-2592-z. Epub 2017 Jul 19. Cell Mol Life Sci. 2017. PMID: 28726057 Free PMC article.
-
Discovery of novel MIF inhibitors that attenuate microglial inflammatory activation by structures-based virtual screening and in vitro bioassays.Acta Pharmacol Sin. 2022 Jun;43(6):1508-1520. doi: 10.1038/s41401-021-00753-x. Epub 2021 Aug 24. Acta Pharmacol Sin. 2022. PMID: 34429524 Free PMC article.
-
Macrophage migration inhibitory factor in Nodding syndrome.PLoS Negl Trop Dis. 2021 Oct 18;15(10):e0009821. doi: 10.1371/journal.pntd.0009821. eCollection 2021 Oct. PLoS Negl Trop Dis. 2021. PMID: 34662363 Free PMC article.
-
A nuclease that mediates cell death induced by DNA damage and poly(ADP-ribose) polymerase-1.Science. 2016 Oct 7;354(6308):aad6872. doi: 10.1126/science.aad6872. Science. 2016. PMID: 27846469 Free PMC article.
References
-
- Alexander JK, Cox GM, Tian JB, Zha AM, Wei P, Kigerl KA, Reddy MK, Dagia NM, Sielecki T, Zhu MX, Satoskar AR, McTigue DM, Whitacre CC, Popovich PG (2012) Macrophage migration inhibitory factor (MIF) is essential for inflammatory and neuropathic pain and enhances pain in response to stress. Exp Neurol 236(2):351–362. doi:10.1016/j.expneurol.2012.04.018 - PMC - PubMed
-
- Bank LM, Bianchi LM, Ebisu F, Lerman-Sinkoff D, Smiley EC, Shen YC, Ramamurthy P, Thompson DL, Roth TM, Beck CR, Flynn M, Teller RS, Feng L, Llewellyn GN, Holmes B, Sharples C, Coutinho-Budd J, Linn SA, Chervenak AP, Dolan DF, Benson J, Kanicki A, Martin CA, Altschuler R, Koch AE, Jewett EM, Germiller JA, Barald KF (2012) Macrophage migration inhibitory factor acts as a neurotrophin in the developing inner ear. Development 139(24):4666–4674. doi:10.1242/dev.066647 - PMC - PubMed
Publication types
MeSH terms
Substances
LinkOut - more resources
Full Text Sources
Other Literature Sources
Molecular Biology Databases
Research Materials
Miscellaneous
