. 2014 Aug 14;5(8):e1373.
doi: 10.1038/cddis.2014.328.

The protease Omi regulates mitochondrial biogenesis through the GSK3β/PGC-1α pathway

Affiliations

The protease Omi regulates mitochondrial biogenesis through the GSK3β/PGC-1α pathway

R Xu et al. Cell Death Dis. .

Abstract

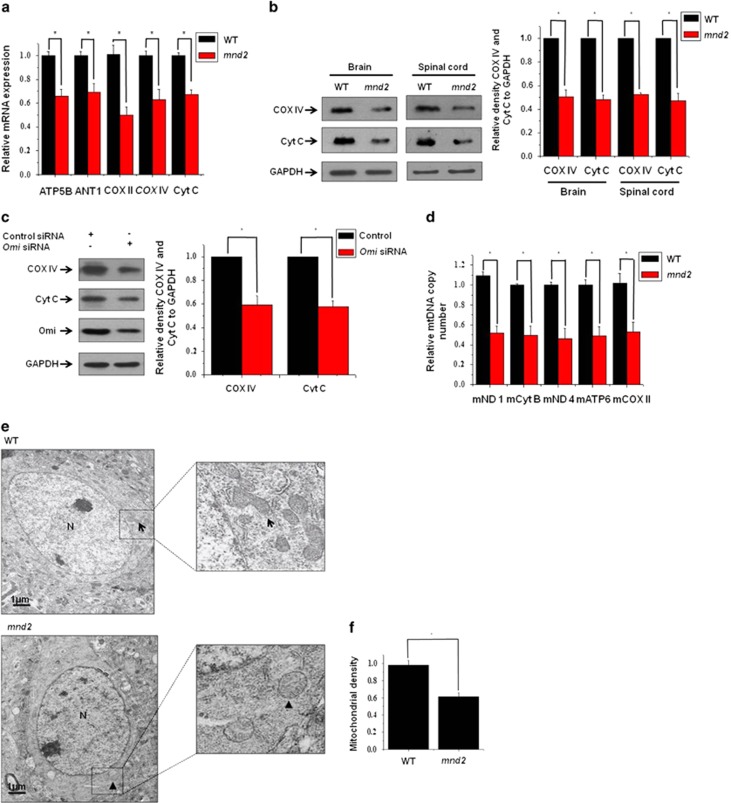
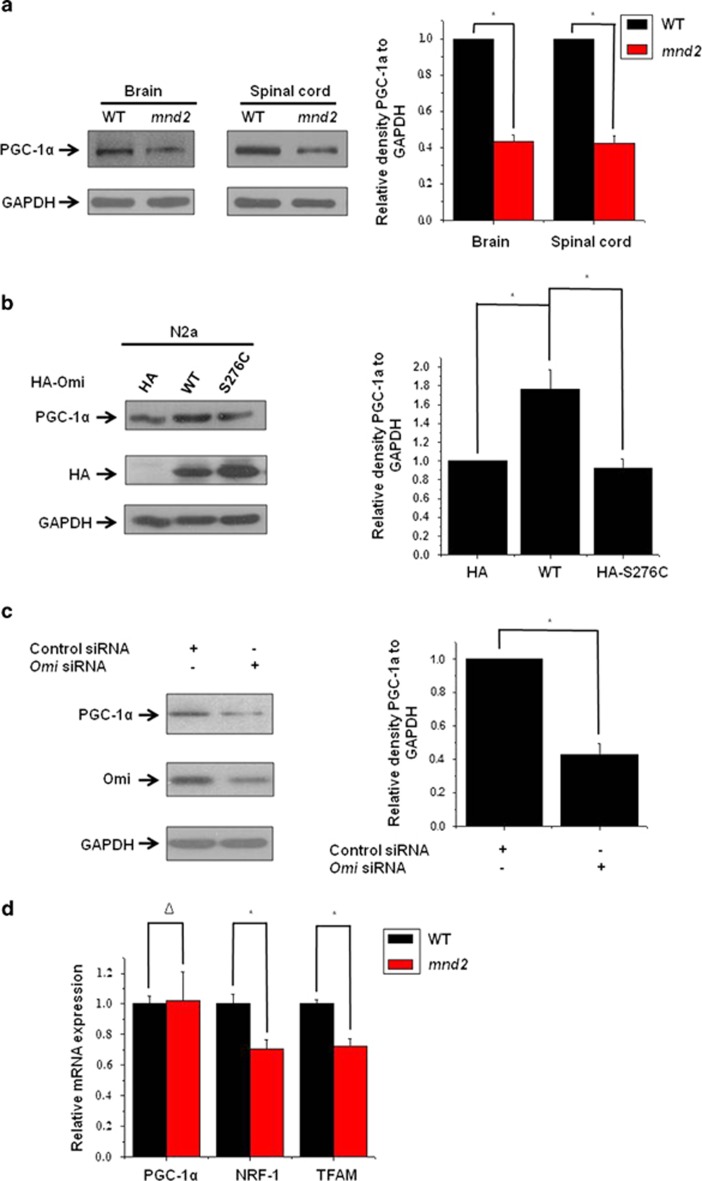
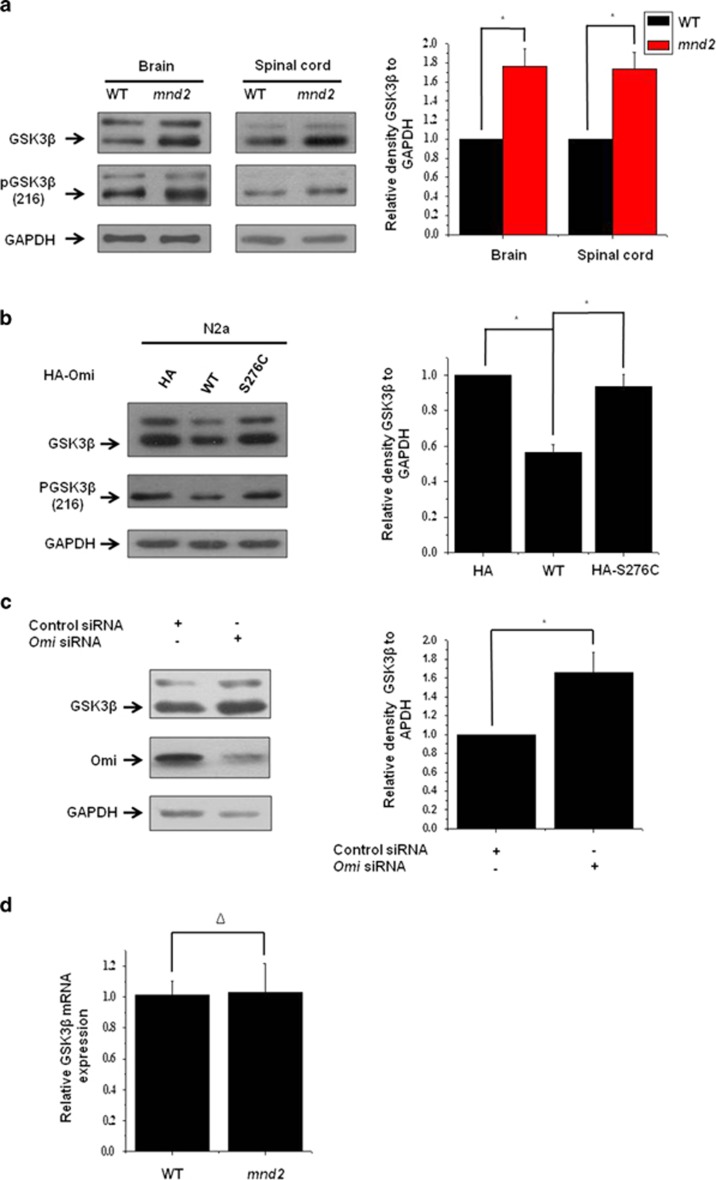
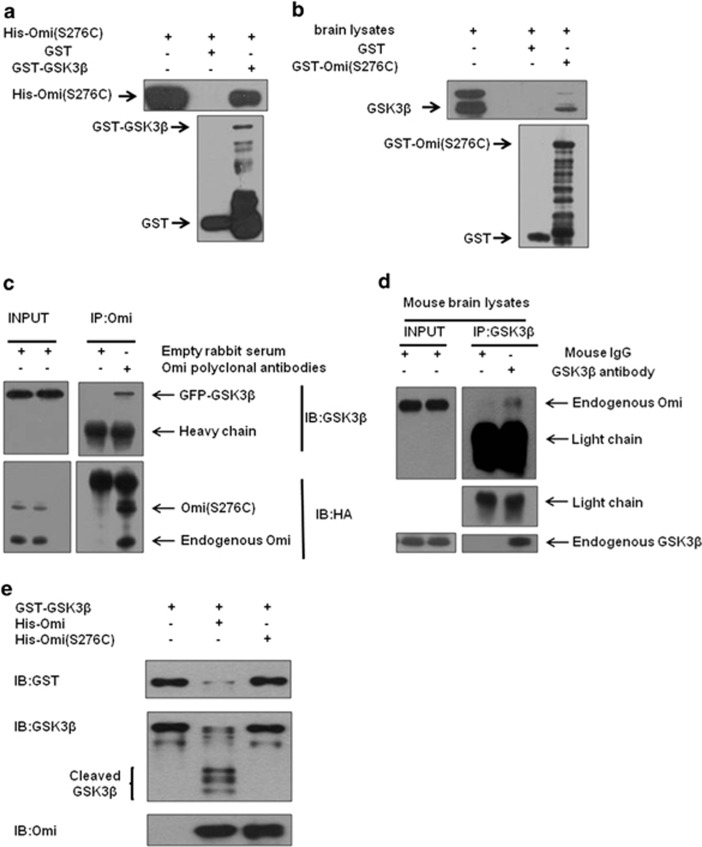
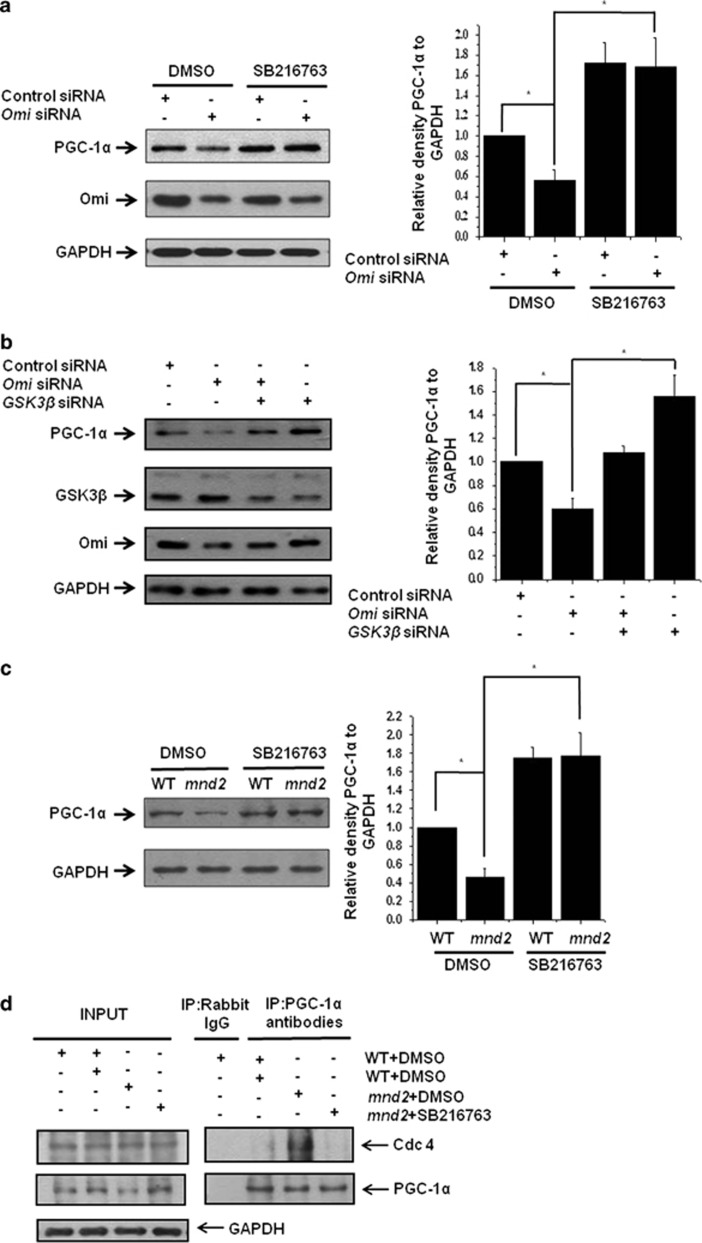
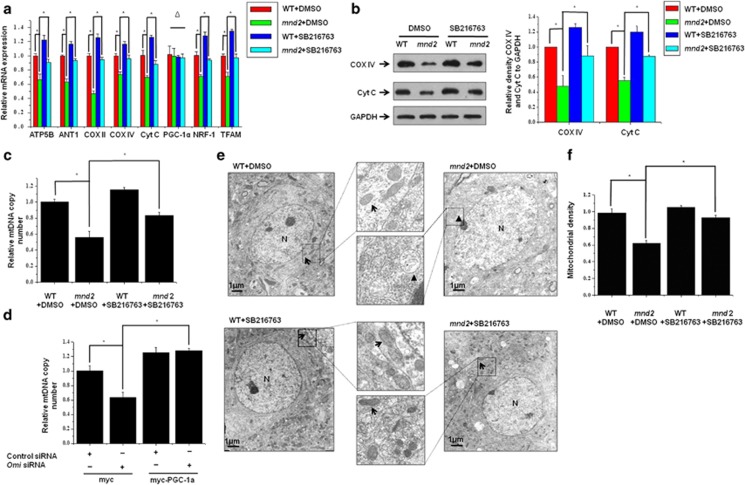
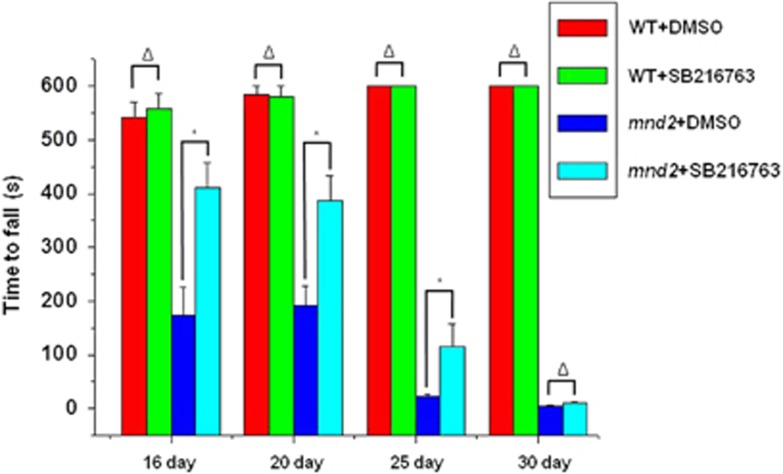
Loss of the mitochondrial protease activity of Omi causes mitochondrial dysfunction, neurodegeneration with parkinsonian features and premature death in mnd2 (motor neuron degeneration 2) mice. However, the detailed mechanisms underlying this pathology remain largely unknown. Here, we report that Omi participates in the process of mitochondrial biogenesis, which has been linked to several neurodegenerative diseases. The mitochondrial biogenesis is deficit in mnd2 mice, evidenced by severe decreases of mitochondrial components, mitochondrial DNA and mitochondrial density. Omi cleaves glycogen synthase kinase 3β (GSK3β), a kinase promoting PPARγ coactivator-1α (PGC-1α) degradation, to regulate PGC-1α, a factor important for the mitochondrial biogenesis. In mnd2 mice, GSK3β abundance is increased and PGC-1α abundance is decreased significantly. Inhibition of GSK3β by SB216763 or overexpression of PGC-1α can restore mitochondrial biogenesis in mnd2 mice or Omi-knockdown N2a cells. Furthermore, there is a significant improvement of the movement ability of mnd2 mice after SB216763 treatment. Thus, our study identified Omi as a novel regulator of mitochondrial biogenesis, involving in Omi protease-deficient-induced neurodegeneration.


Figures

Figure 1
Figure 1
Omi regulates mitochondrial components. (a) Real-time RT-qPCR assays were performed showing that the mRNA levels of the components of the mitochondrial respiration chain and oxidant metabolism, including ATP5B, COX IV, COX II, CytC and ANT1 are decreased in the mnd2 mice of 25 days compared with those in wide-type mice of the same age. n=3–4 per group, *P<0.05; one-way ANOVA. (b) Western blotting analysis was performed showing that COX IV and Cyt C protein abundances were decreased in the brains and spinal cord of mnd2 mice of 25 days compared with those in wild-type mice of the same age. Densitometric analyses from three independent experiments were quantified by one-way ANOVA, *P<0.05. (c) Western blotting analysis was performed showing that the knockdown of Omi decreases COX IV and Cyt C protein abundance in SH-SY5Y cells. Densitometric analyses from three independent experiments were quantified by one-way ANOVA, *P<0.05. (d) Real-time RT-qPCR assays were performed showing that the relative mtDNA copy number was decreased in the mnd2 mice of 25 days compared with those wide-type mice of the same age. n=3–4 per group, *P<0.05; one-way ANOVA. (e) Transmission electron microscopy was performed showing an obviously decreased proliferation of mitochondria in striatum from 25-day-old mnd2 mice when compared with that in the wide-type mice. The arrow indicates normal mitochondria, arrowhead indicates damage mitochondria and N indicates nucleus. (f) Quantitative morphometric measurements of the mitochondrial density were based on the analysis of Electron micrographs (five sections from every animal and three animals per group). The magnification is × 5000. Densitometric analyses were quantified by one-way ANOVA, *P<0.05
Figure 2
Figure 2
Omi protease activity regulates PGC-1α levels. (a) Western blotting analysis was performed showing that PGC-1α protein abundances were lower in the brains and spinal cord of mnd2 mice of 25 days compared with those in wild-type mice of the same age. Densitometric analyses from three independent experiments were quantified by one-way ANOVA, *P<0.05. (b) Western blotting analysis was performed showing that HA-tag full-length Omi, but not HA alone or HA-tagged full-length S276C mutant Omi, increased PGC-1α protein abundance. Densitometric analyses from three independent experiments were quantified by one-way ANOVA, *P<0.05. (c) Western blotting analysis was performed, showing that knockdown of Omi decreases PGC-1α protein abundance in SH-SY5Y cells. Densitometric analyses from three independent experiments were quantified by one-way ANOVA, *P<0.05. (d) Real-time RT-qPCR assays were performed showing that the mRNA levels of NRF-1 and TFAM were decreased and that PGC-1α is not altered in the mnd2 mice of 25 days compared with wide-type mice of the same age. n=3–4 per group, *P<0.05; Δ, no significance; one-way ANOVA
Figure 3
Figure 3
Omi represses GSK3β expression. (a) Western blotting analysis was performed, showing that GSK3β protein abundances were increased in the brains and spinal cord of mnd2 mice of 25 days compared with those in wild-type mice of the same asge. Densitometric analyses from three independent experiments were quantified by one-way ANOVA, *P<0.05. (b) Western blotting analysis was performed showing that HA-tag full-length Omi, but not HA alone or HA-tagged full-length S276C mutant Omi, decreased GSK3β protein abundance. Densitometric analyses from three independent experiments were quantified by one-way ANOVA, *P<0.05. (c) Western blotting analysis was performed showing that the knockdown of Omi increased GSK3β protein abundance in SH-SY5Y cells. Densitometric analyses from three independent experiments were quantified by one-way ANOVA, *P<0.05. (d) Real-time RT-qPCR assays were performed showing that the mRNA levels of GSK3β were not altered in the mnd2 mice of 25 days compared with those in wide-type mice of the same age. n=3–4 per group, Δ, no significance; one-way ANOVA
Figure 4
Figure 4
GSK3β is a substrate of Omi. (a) In vitro pulldown assays were performed showing that GST-GSK3β but not GST alone, interacted with His-Omi. Three independent experiments were performed. (b) The semi in vivo pulldown assays were performed showing that GST-S276C mutant Omi but not GST alone, pulled down endogenous GSK3β from brain lysates. Three independent experiments were performed. (c) Immunoprecipitation assays were performed showing that Omi interacted with GSK3β in N2a cells. Three independent experiments were performed. (d) Immunoprecipitation assays showed that endogenous Omi interacted with endogenous GSK3β in the brain of mice. Three independent experiments were performed. (e) In vitro cleavage assays showed that GST-GSK3β was cleaved by His-Omi, but not by His-Omi S276C. In vitro purified GST-GSK3β was incubated with WT or protease-inactive S276C Omi for 60 min in protease buffer at 37 °C. The incubated mixtures were subjected to western blotting analysis with an anti-GST or anti-GSK3β antibody. The brace indicates proteolytic fragments. Three independent experiments were performed
Figure 5
Figure 5
Omi regulates PGC-1α through GSK3β. (a) Western blotting analysis was performed showing that the knockdown of Omi decreased PGC-1α protein abundance; however, the effects of Omi knockdown were blocked by treatment with SB216763 (5 μM) for 24 h. SHSY-5Y cells were transfected with si-NC or si-Omi, and 24 h after transfection, cells were treated with DMSO or 5 μM SB216763 for another 24 h. Densitometric analyses from three independent experiments were quantified by one-way ANOVA, *P<0.05. (b) Western blotting analysis was performed showing that the knockdown of Omi decreased PGC-1α protein abundance; however, PGC-1α protein abundances were restored when GSK3β was also knockdown. Densitometric analyses from three independent experiments were quantified by one-way ANOVA, *P<0.05. (c) Western blotting analysis was performed showing that PGC-1α protein abundances were decreased in the brains in mnd2 mice; however, PGC-1α protein abundances were increased significantly in SB216763-treated mnd2 mice of 25 days compared with DMSO-treated mnd2 mice. Densitometric analyses from three independent experiments were quantified by one-way ANOVA, *P<0.05. (d) Immunoprecipitation assays showed that the interaction of PGC-1α and Cdc4 was significantly increased in DMSO-treated mnd2 mice as compared with wild-type mice; however, the interaction of PGC-1α and Cdc4 was decreased in mnd2 mice after SB216763 treatment
Figure 6
Figure 6
Inhibition of GSK3β and overexpression of PGC-1α restore mitochondrial biogenesis influenced by Omi. (a) Real-time RT-qPCR assays were performed, showing that the mRNA levels of ATP5B, ANT1, COX II, COX IV, CytC, NRF-1 and TFAM were decreased; however, the mRNA was increased significantly in SB216763-treated mnd2 mice of 25 days compared with DMSO-treated mnd2 mice. The mRNA levels of PGC-1α was not changed in SB216763 or DMSO-treated mnd2 mice. n=3–4 per group, *P<0.05; Δ means no significance; one-way ANOVA. (b) Western blotting analysis was performed showing that COX IV and Cyt C protein abundances were decreased in the brains in mnd2 mice; however, COX IV and Cyt C protein abundances were increased significantly in SB216763-treated mnd2 mice of 25 days compared with DMSO-treated mnd2 mice. Densitometric analyses from three independent experiments were quantified by one-way ANOVA, *P<0.05. (c) Real-time RT-qPCR assays show that mtDNA copy number was decreased in mnd2 mice; however, the mtDNA copy number was increased significantly in SB216763-treated mnd2 mice of 25 days compared with DMSO-treated mnd2 mice. n=4 per group,*P<0.05; one-way ANOVA. (d) Real-time RT-qPCR assays were performed, showing that knockdown of Omi reduced expression of mtDNA copy number; however, the effect of Omi knockdown was rescued by overexpressing PGC-1α in N2a cell. Densitometric analyses from three independent experiments were quantified by one-way ANOVA, *P<0.05. (e) Transmission electron microscopy was performed showing an obviously decreased proliferation of mitochondria in striatum from mnd2 mice; however, the effects were rescued in SB216763-treated mnd2 mice of 25 days compared with DMSO-treated mnd2 mice. The arrow indicates normal mitochondria, arrowhead indicates damage mitochondria and N indicates nucleus. (f) Quantitative morphometric measurements of the mitochondrial density were based on analysis of electron micrographs (five sections from every animal and three animals per group). The magnification is × 5000. Densitometric analyses were quantified by one-way ANOVA, *P<0.05
Figure 7
Figure 7
Inhibition of GSK3β improves movement ability of mnd2 mice. The rotarod test showed that the performance of mnd2 mice was severely deteriorated compared with wide-type mice treated with DMSO; however, the performance was significantly improved in SB216763-treated mnd2 mice of 16, 20, 25 and 30 days old compared with DMSO-treated mnd2 mice. There was no significant difference of wide-type mice treated with DMSO or SB216763. n=10 per group, *P<0.05; Δ, no significance; one-way ANOVA

Similar articles

Cited by

References

    1. Nicholls DG, Budd SL. Mitochondria and neuronal survival. Physiol Rev. 2000;80:315–360. - PubMed
    1. Van Laar VS, Berman SB. The interplay of neuronal mitochondrial dynamics and bioenergetics: implications for Parkinson's disease. Neurobiol Dis. 2013;51:43–55. - PMC - PubMed
    1. Anne Stetler R, Leak RK, Gao Y, Chen J. The dynamics of the mitochondrial organelle as a potential therapeutic target. J Cereb Blood Flow Metab. 2013;33:22–32. - PMC - PubMed
    1. Lin MT, Beal MF. Mitochondrial dysfunction and oxidative stress in neurodegenerative diseases. Nature. 2006;443:787–795. - PubMed
    1. Abou-Sleiman PM, Muqit MM, Wood NW. Expanding insights of mitochondrial dysfunction in Parkinson's disease. Nat Rev Neurosci. 2006;7:207–219. - PubMed

Publication types

MeSH terms

LinkOut - more resources