. 2014 Dec;4(1-2):41-55.
doi: 10.1007/s13554-014-0018-0. Epub 2014 Aug 14.

Enhancing Patient Flexibility of Subcutaneous Immunoglobulin G Dosing: Pharmacokinetic Outcomes of Various Maintenance and Loading Regimens in the Treatment of Primary Immunodeficiency

Affiliations

Enhancing Patient Flexibility of Subcutaneous Immunoglobulin G Dosing: Pharmacokinetic Outcomes of Various Maintenance and Loading Regimens in the Treatment of Primary Immunodeficiency

Jagdev Sidhu et al. Biol Ther. 2014 Dec.

Abstract

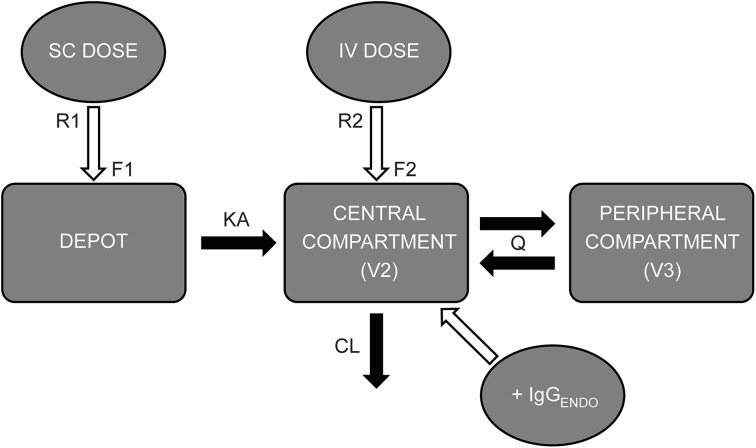
Introduction: Standard treatment for patients with primary immunodeficiency (PID) is monthly intravenous immunoglobulin (IVIG), or weekly/biweekly subcutaneous immunoglobulin (SCIG) infusion. We used population pharmacokinetic modeling to predict immunoglobulin G (IgG) exposure following a broad range of SCIG dosing regimens for initiation and maintenance therapy in patients with PID.

Methods: Simulations of SCIG dosing were performed to predict IgG concentration-time profiles and exposure metrics [steady-state area under the IgG concentration-time curve (AUC), IgG peak concentration (C max), and IgG trough concentration (C min) ratios] for various infusion regimens.

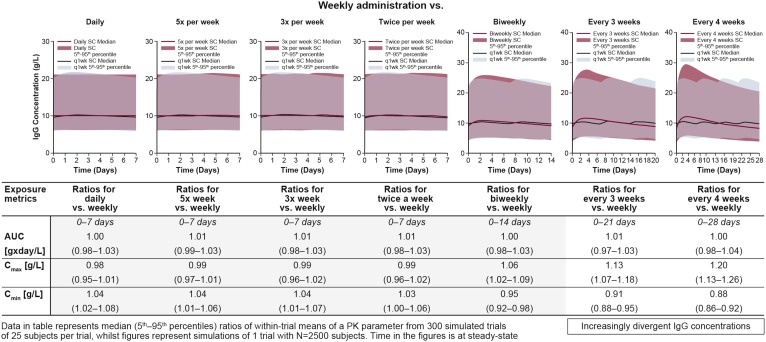
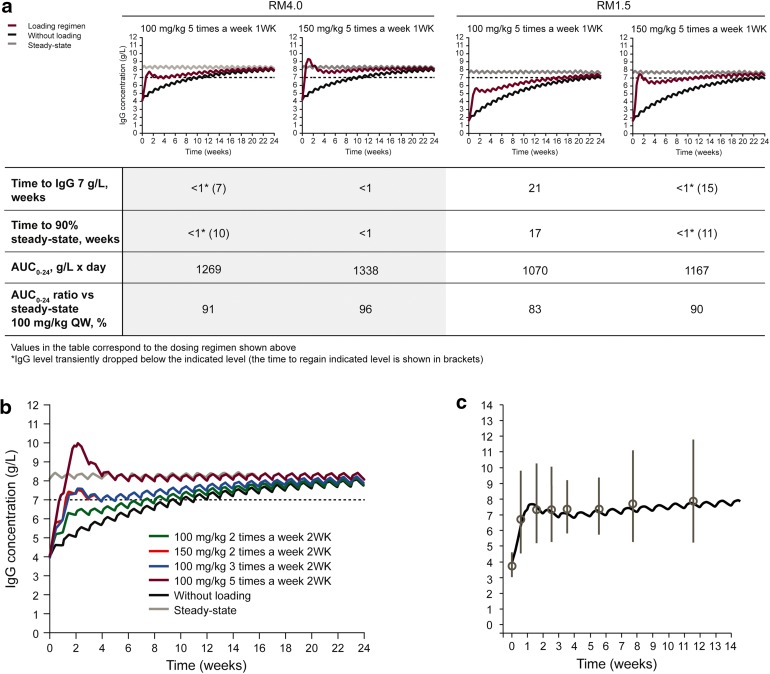
Results: The equivalent of a weekly SCIG maintenance dose administered one, two, three, five, or seven times per week, or biweekly produced overlapping steady-state concentration-time profiles and similar AUC, C max, and C min values [95% confidence interval (CI) for ratios was 0.98-1.03, 0.95-1.09, and 0.92-1.08, respectively]. Administration every 3 or 4 weeks resulted in higher peaks and lower troughs; the 95% CI of the AUC, C max, and C min ratios was 0.97-1.04, 1.07-1.26, and 0.86-0.95, respectively. IgG levels >7 g/L were reached within 1 week using a loading dose regimen in which the weekly maintenance dose was administered five times in the first week of treatment. In patients with very low endogenous IgG levels, administering 1.5 times the weekly maintenance dose five times in the first week of treatment resulted in a similar response.

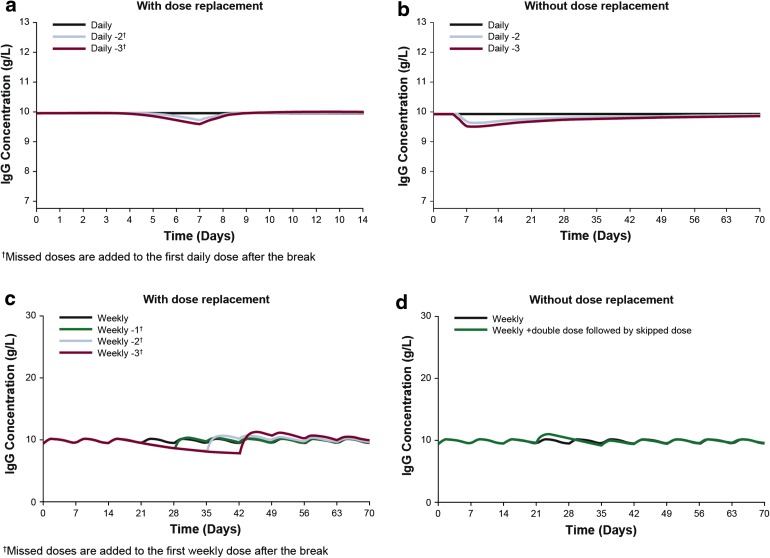
Conclusions: The same total weekly SCIG dose can be administered at different intervals, from daily to biweekly, with minimal impact on serum IgG levels. Several SCIG loading regimens rapidly achieve adequate serum IgG levels in treatment-naïve patients.

Keywords: Biological therapy; Dosing regimen; Hizentra®; Immunoglobulin replacement therapy; Loading dose; Pharmacokinetic model; Primary immunodeficiency; Skipped doses; Subcutaneous immunoglobulin.


Figures

Fig. 1
Fig. 1
Schematic diagram of the two-compartment population PK model. CL clearance (L/day), F1 bioavailability of subcutaneous (SC) immunoglobulin, F2 bioavailability of intravenous (IV) immunoglobulin (=1.00), IgG ENDO endogenous serum IgG concentration (g/L), KA absorption rate constant of subcutaneous dose (day−1), Q inter-compartmental clearance (L/day), R1 rate of subcutaneous dose administration (g/day), R2 rate of intravenous administration (g/day), V2 volume of distribution of central compartment (L), V3 volume of distribution of peripheral compartment (L). Reprinted from Postgraduate Medicine, 125, Landersdorfer CB, Bexon M, Edelman J, et al. Pharmacokinetic modeling and simulation of biweekly subcutaneous immunoglobulin dosing in primary immunodeficiency, page 55, Copyright 2013, with permission from JTE Multimedia, LLC
Fig. 2
Fig. 2
Steady-state IgG concentration–time profiles for various simulated subcutaneous immunoglobulin dosing regimens, using the RM4.0 reference model. Median IgG concentrations (black line) with 5th and 95th percentile (blue shaded area) for weekly dosing, compared with median concentrations (red line) and 5th to 95th percentiles (red shaded area) of IgG concentration for alternative dosing regimens. C min and C max values are also displayed in tabulated form. AUC area under the concentration–time curve, IgG immunoglobulin G, C min minimum concentration, C max maximum concentration, PK pharmacokinetic, SC subcutaneous
Fig. 3
Fig. 3
Simulations for skipped doses during daily and weekly subcutaneous immunoglobulin. Median steady-state IgG concentrations simulating a daily dosing regimen (black line) in which either two (blue line) or three (red line) consecutive doses are skipped, and where there is (a) compensation or (b) no compensation for skipped doses upon resumption of daily dosing. c Median steady-state IgG concentrations for a weekly dosing regimen (black line) in which either one (green line), two (blue line), or three (red line) doses are skipped from day 21 and compensated for upon resuming therapy, or (d) a double dose administered on day 21 and a dose skipped on day 28, without compensation. IgG immunoglobulin G
Fig. 4
Fig. 4
Simulated IgG concentration–time profiles for various subcutaneous immunoglobulin (SCIG) loading regimens. Steady-state (gray line) and SCIG without a loading phase (black line) are shown as comparators for different loading dose regimen. a 1-week loading phase using models RM4.0 and RM1.5 and (b) 2-week loading phase using model RM4.0. c Loading regimen of 5 × 100 mg/kg WK1 using model RM4.0 (black line) overlaid on observed clinical data (gray circles mean IgG concentration; gray lines standard error of the mean) reported by Borte et al. [39]. AUC area under the concentration–time curve, IgG immunoglobulin G, QW once a week

Similar articles

Cited by

References

    1. Buckley RH. Primary immunodeficiency diseases due to defects in lymphocytes. N Engl J Med. 2000;343(18):1313–1324. doi: 10.1056/NEJM200011023431806. - DOI - PubMed
    1. Chapel H, Geha R, Rosen F. Primary immunodeficiency diseases: an update. Clin Exp Immunol. 2003;132(1):9–15. doi: 10.1046/j.1365-2249.2003.02110.x. - DOI - PMC - PubMed
    1. Cunningham-Rundles C, Bodian C. Common variable immunodeficiency: clinical and immunological features of 248 patients. Clin Immunol. 1999;92(1):34–48. doi: 10.1006/clim.1999.4725. - DOI - PubMed
    1. Lougaris V, Ferrari S, Plebani A. Ig beta deficiency in humans. Curr Opin Allergy Clin Immunol. 2008;8(6):515–519. doi: 10.1097/ACI.0b013e328314b621. - DOI - PubMed
    1. Notarangelo LD, Fischer A, Geha RS, et al. Primary immunodeficiencies: 2009 update. J Allergy Clin Immunol. 2009;124(6):1161–1178. doi: 10.1016/j.jaci.2009.10.013. - DOI - PMC - PubMed

LinkOut - more resources