. 2014 Oct 30;514(7524):628-32.
doi: 10.1038/nature13611. Epub 2014 Aug 10.

Oncogene ablation-resistant pancreatic cancer cells depend on mitochondrial function

Affiliations

Oncogene ablation-resistant pancreatic cancer cells depend on mitochondrial function

Andrea Viale et al. Nature. .

Abstract

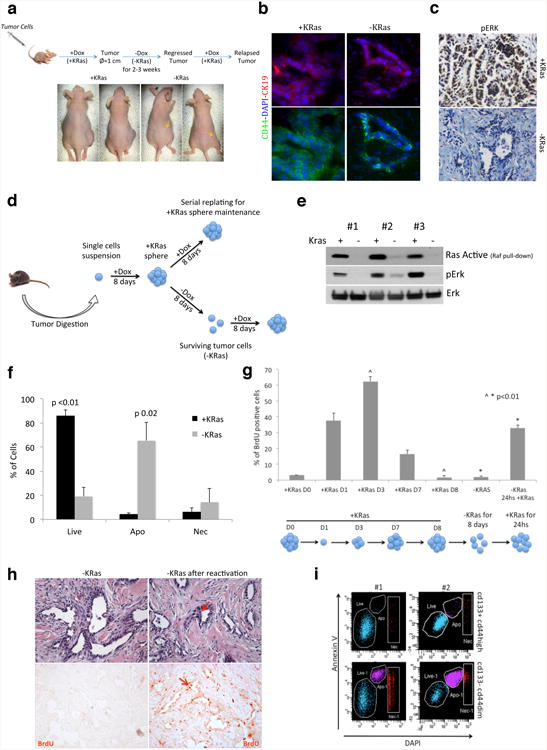
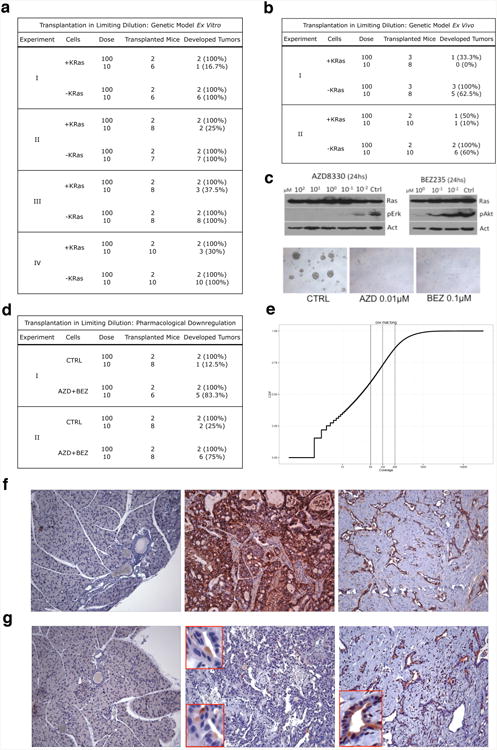
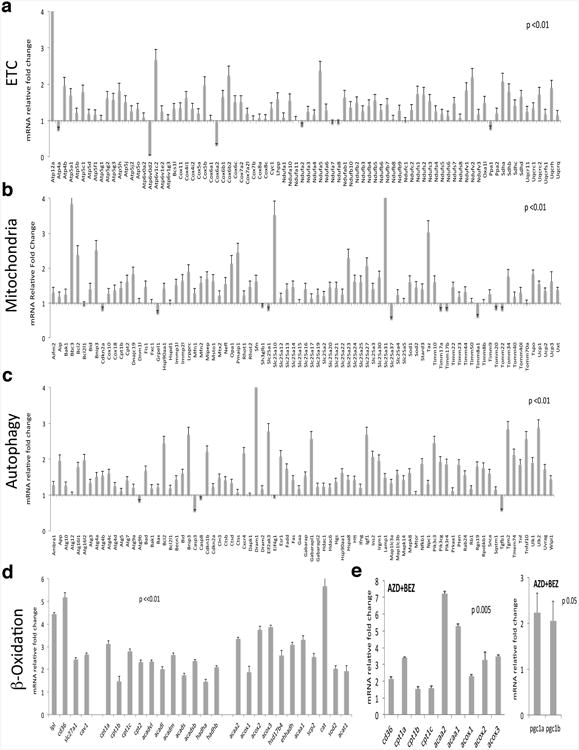
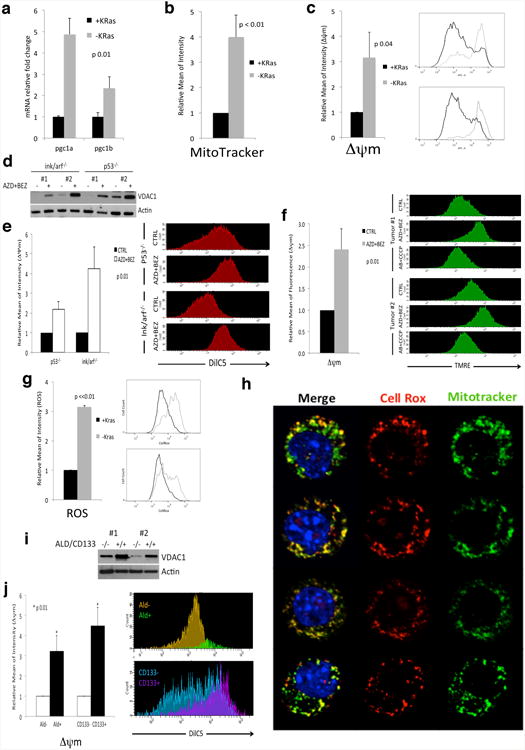
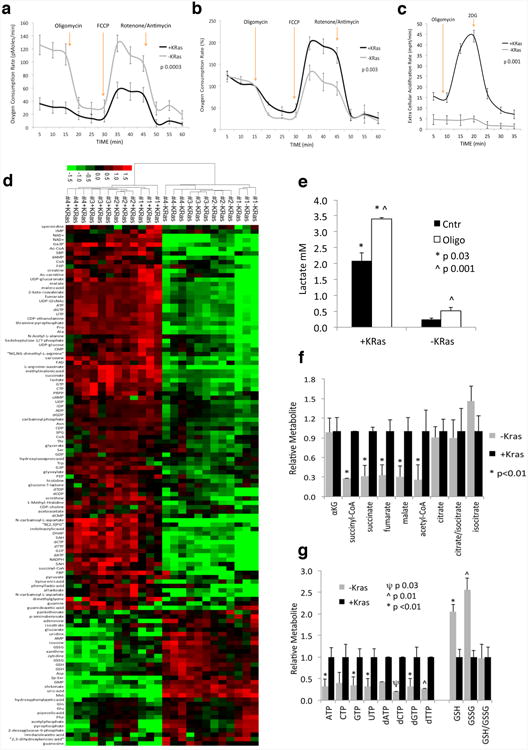
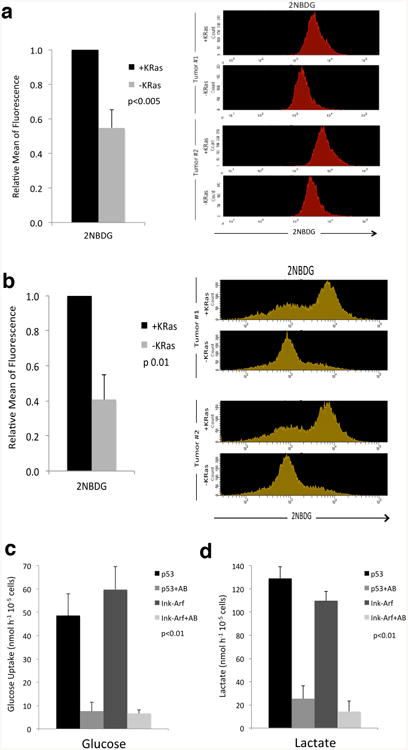
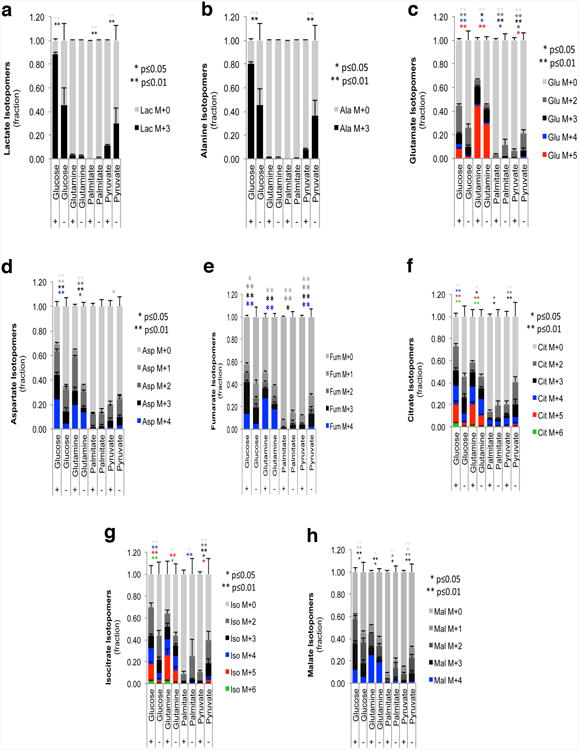
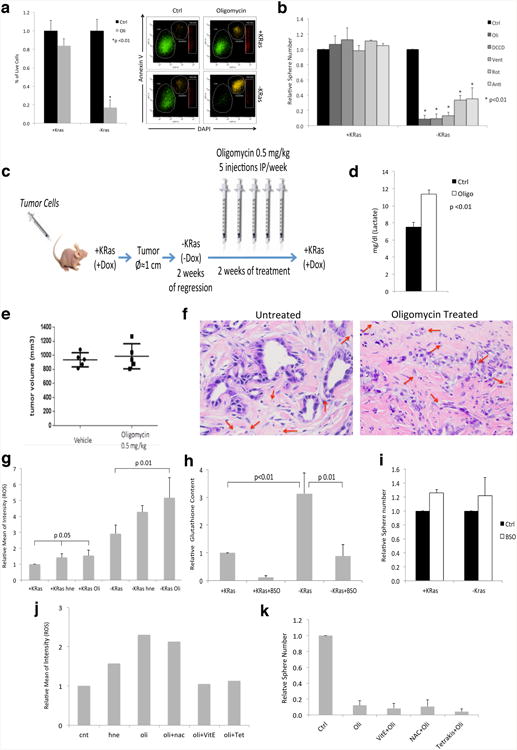
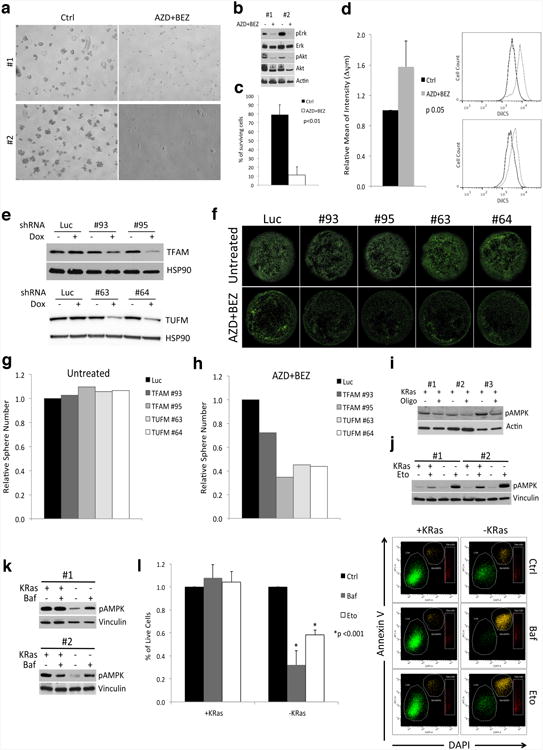
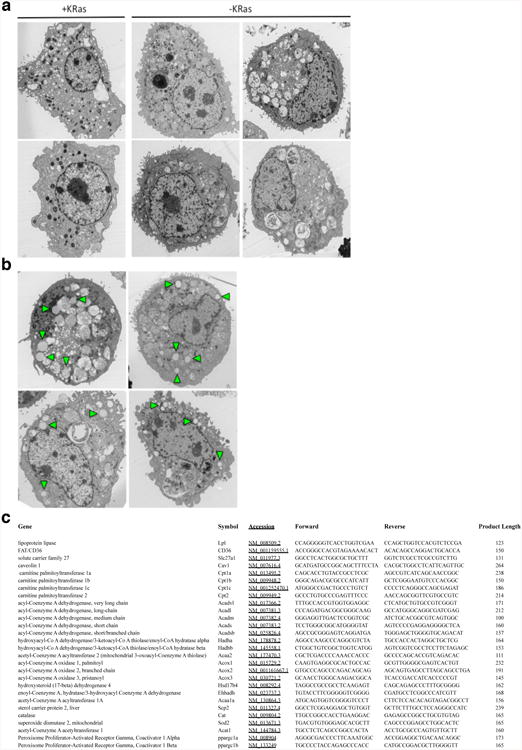
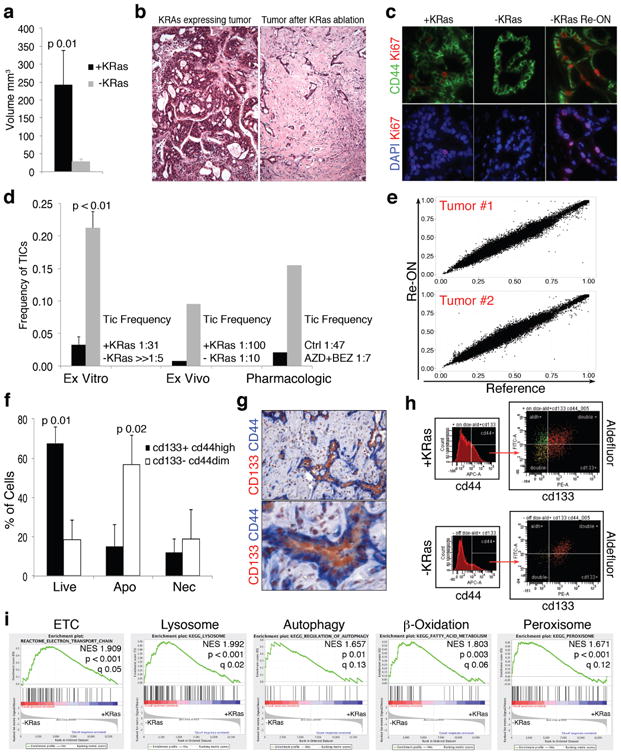
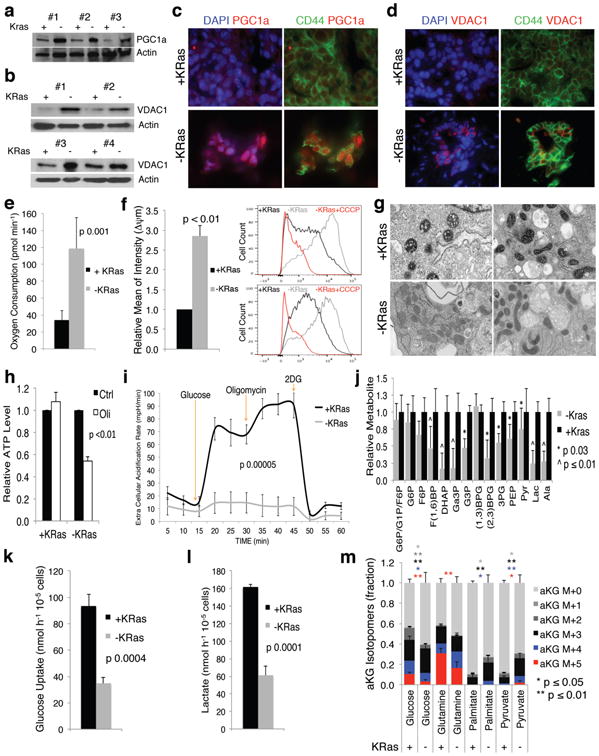
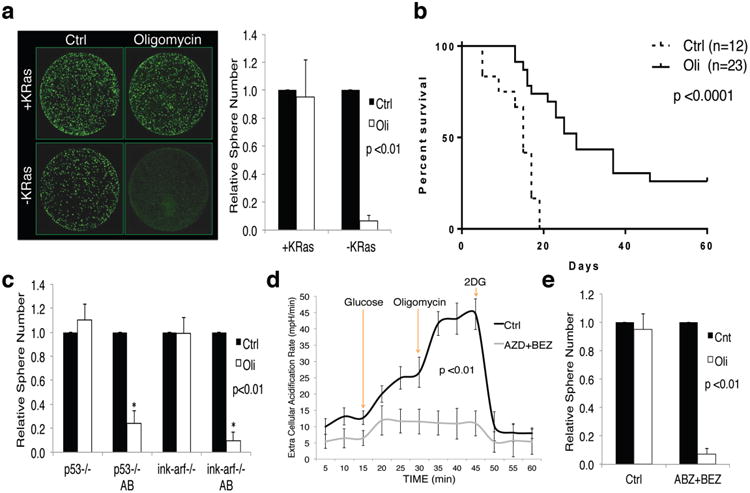
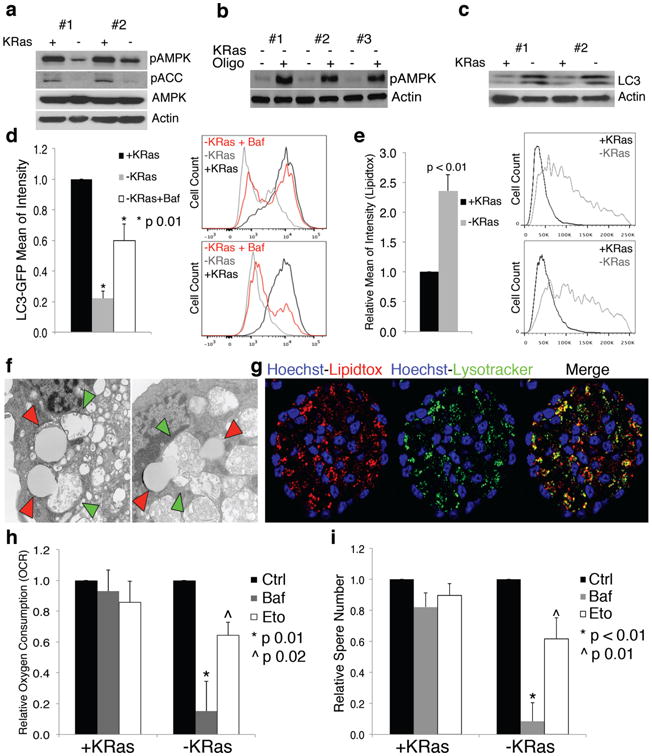
Pancreatic ductal adenocarcinoma (PDAC) is one of the deadliest cancers in western countries, with a median survival of 6 months and an extremely low percentage of long-term surviving patients. KRAS mutations are known to be a driver event of PDAC, but targeting mutant KRAS has proved challenging. Targeting oncogene-driven signalling pathways is a clinically validated approach for several devastating diseases. Still, despite marked tumour shrinkage, the frequency of relapse indicates that a fraction of tumour cells survives shut down of oncogenic signalling. Here we explore the role of mutant KRAS in PDAC maintenance using a recently developed inducible mouse model of mutated Kras (Kras(G12D), herein KRas) in a p53(LoxP/WT) background. We demonstrate that a subpopulation of dormant tumour cells surviving oncogene ablation (surviving cells) and responsible for tumour relapse has features of cancer stem cells and relies on oxidative phosphorylation for survival. Transcriptomic and metabolic analyses of surviving cells reveal prominent expression of genes governing mitochondrial function, autophagy and lysosome activity, as well as a strong reliance on mitochondrial respiration and a decreased dependence on glycolysis for cellular energetics. Accordingly, surviving cells show high sensitivity to oxidative phosphorylation inhibitors, which can inhibit tumour recurrence. Our integrated analyses illuminate a therapeutic strategy of combined targeting of the KRAS pathway and mitochondrial respiration to manage pancreatic cancer.


Figures

Extended Data Figure 1
Extended Data Figure 1. Oncogene ablation leads to tumor regression in vitro and in vivo
a, In vivo experimental scheme. Tumor cells isolated from primary tumors or tumor spheres were injected in nude mice fed with doxycycline in drinking water (+Dox). When mice developed tumors, doxycycline was withdrawn (-Dox) and tumors underwent a complete macroscopic regression after 2-3 weeks (arrows indicate regressed tumors). In residual lesions few tumor cells remain quiescent for months and they can quickly reform tumors upon KRas reactivation (+Dox). b-c, Tumor expressing KRas (+KRas) and tumor remnants after regression (-KRas) are positive for ductal epithelial marker CK19 (b) (40×). Tumor expressing KRas (+KRas) and epithelial remnants after tumor regression (-KRas) were stained for phosphorylated-p42/44 (pErk). No signal is detected in surviving cells (c) (20×). d, In vitro experimental scheme. After digestion to a single cells suspension, tumor cells isolated from primary tumors were plated in stem cell medium in presence of doxycycline (+Dox, +KRas). Spherogenic cells form tumor spheres (+KRas) that can be maintained by serial replating in presence of doxycycline. Upon doxycycline withdrawal (-Dox) tumor spheres undergo involution and only a minority of cells survives the ablation of KRas (surviving cells, -KRas). Surviving cells readily reform tumor spheres upon re-activation of KRas (+Dox). e, The amount of active Ras in KRas expressing cells (+KRas) and surviving cells (-KRas) has been evaluated in three independent tumor spheres by detecting the fraction of Ras protein that co-precipitates with Raf kinase. Total lysates were probed with anti-phospho-p42/44 (pErk), total p42/44 (Erk) antibodies. f, AnnexinV staining in tumor spheres after 3 days +/-KRas (n=3). g, Sphere formation is a regulated process and tumor cells enter and exit cell cycle. BrdU incorporation (pulse of 3 hours) has been evaluated at different time points during sphere formation and regression. KRas expressing fully formed spheres (Day 0 and 8) are quiescent. Upon sphere dissociation and replating (D0), spherogenic cells enter cell cycle (D1) and tumor cells continue to grow till day 3-4, when spheres reach their maximal S-phase. Then tumor cells gradually exit the cell cycle and become quiescent (D8). After doxycycline withdrawing (-KRas) tumor spheres undergo involution and surviving cells remain quiescent till KRas is re-expressed (-KRas 24hs +KRas) and spheres are reformed. Ruling out the effect of the cell cycle, transcriptomic and metabolomic characterizations have been done matching quiescent surviving tumor cells to quiescent fully formed KRas expressing spheres at D8 (n=3). h, HE and IHC of regressed tumors after three 8-hour pulses of BrdU show that epithelial remnants in regressed tumors after KRas ablation (-KRas) are completely quiescent (left panels). 48 hours after KRas reactivation (doxycycline IP injection) tumor cells re-enter massively the cell cycle (right panels). Red arrows indicate mitotic cells (20×). i, Representative AnnexinV staining with respect to CD133 and CD44 after three days of KRas ablation, two independent tumors are represented. Data are mean ± s.d.
Extended Data Figure 2
Extended Data Figure 2. Transplantation in limiting dilution and characterization of epithelial remnants
a-d, Transplantation in limiting dilution. Experiments, number of transplanted mice and percentage of developed tumor are shown. a, Limiting dilution experiments using tumor spheres (+KRas) and surviving cells (-KRas) (genetic model ex vitro). b, Limiting dilution experiments using cells isolated from KRas expressing (+KRas) and regressed tumors (-KRas) (genetic model ex vivo). c, Upper panels: immunoblots of tumor spheres treated with different concentrations of Mek1 (AZD8330) and a dual PI3K/mTOR (BEZ235) inhibitors probed with anti-phospho-p42/44 (pErk), phospho-Akt (pAkt), pan- Ras (Ras) and β-actin (Act) antibodies. Lower panels: Effects of AZD8330 (AZD 0.01µM) and BEZ235 (BEZ 0.1µM) treatment for 1 week on tumor sphere formation, some cells, as single or in small clusters, are able to survive the treatment (5×). d, Limiting dilution experiments using cells surviving pharmacologic downregulation of oncogenic pathways (AZD+BEZ, combination of AZD8330 and BEZ235) and control cells (CTRL). e, The plot shows the cumulative distribution of coverage at all the SNVs called by Unified Genotyper (across samples). f, CD44 is expressed during tumorigenesis in mouse: no positive cells are detected in normal pancreas (left panel), KRas expressing tumors express high level of CD44 (middle panel), epithelial remnants in regressed tumors maintain their positivity for CD44 (right panel)(10×). g, Validation of CD133 (ab16518) in IHC: this antibody does not recognize cells and ductal structures in normal pancreas (left panel), a small population of cells is stained by ab16518 in KRas expressing tumors (middle panel), epithelial remnants in regressed tumors are strongly positive for CD133 (right panel) (10×). At higher magnification (red boxes) is possible to appreciate the classical polarized pattern of CD133.
Extended Data Figure 3
Extended Data Figure 3. QPCR validation of pathways enriched in surviving cells
mRNA fold change in surviving cells normalized to KRas expressing cells. a, Genes involved in electron transport chain (ETC) (n=5). b, Genes involved in the biogenesis and function of mitochondria (Mitochondria). Genes encoding proteins of the autophagic molecular machinery and its key regulators (n=5) (c) and (β-Oxidation (n=5) (d). e, mRNA fold change in cells surviving AZD8330/BEZ235 treatment (AZD+BEZ) versus controls (n=3). Data are mean ± s.d.
Extended Data Figure 4
Extended Data Figure 4. Surviving cells have more active mitochondria
a, mRNA fold change of PGC1 genes in -KRas versus +KRas cells (n=5). b, Quantification of MitoTracker Green staining in +KRas and -KRas cells (n=3). c, Mitochondrial membrane potential (Δψm) of +KRas and -KRas cells (n=4); representative flow-cytometry analysis of two tumors. d, Immunoblot of two independent tumor spheres derived from different genetic backgrounds (ink/arf-/- and p53-/-) treated or not with AZD8330 and BEZ235 (AZD+BEZ) for 7 days and probed with anti-VDAC1 (VDAC1) and (β-actin (Actin) antibodies. e, Cells surviving AZD+BEZ treatment have higher mitochondrial transmembrane potential (Δψm) than untreated cells (CTRL) (n=3); representative flow-cytometry analysis is reported. f, Mice bearing tumors have been treated (AZD+BEZ) or not (CTRL) with a combination of AZD6244 and BEZ235 for one week. Upon tail vein injection of a bolus of TMRE tumors were explanted and analyzed by flow-cytometry for their mitochondrial potential (Δψm) upon gating on CD44+ DAPI- cells (n=3). A representative flow-cytometry analysis of two different tumors is reported, AB+CCCP samples represent reacquisition of AZD+BEZ samples after incubation with CCCP for 5 minutes. g, ROS production in +KRas and -KRas cells (n=3); representative flow-cytometry analysis of two tumors. h, Live confocal imaging of surviving cells stained for mitochondria (MitoTracker Green), ROS (CellRox-Red) and DNA (Hoechst). The vast majority of signal generated by ROS colocalizes with mitochondria. i, Immunoblot of Aldefluor/CD133 double positive and double negative cells sorted from two independent tumors probed with anti-VDAC1 (VDAC1) and (β-actin (Actin) antibodies. j) KRas expressing cells positive for aldefluor (Ald+) and CD133 (CD133+) have higher mitochondrial transmembrane potential (Δψm) than tumor cells that do not express the same markers (Ald- and CD133-) (n=3); a representative flow-cytometry analysis is reported. Data are mean ± s.d.
Extended Data Figure 5
Extended Data Figure 5. OCR, ECAR and metabolomics
a, Oxygen consumption rate (OCR) of KRas expressing (+KRas) and surviving (-KRas) cells in response to oligomycin, FCCP and rotenone/antimycin (n=4). b, Same as in (a) but normalized to basal respiration of +KRas and -KRas cells. c, Extracellular acidification (ECAR) response of +KRas and -KRas cells to oligomycin and 2-deoxy-D-glucose (2DG). The experiment has been carried out in complete stem cell media to evaluate the glycolytic reserve of tumor cells in a nutrient rich environment. d, Metabolome analysis for +/-KRas cells; unsupervised hierarchical clustering and heat map of significantly (p<0.05) deregulated metabolites (n=4). e, Lactate production of +KRas and -KRas cells in response to oligomycin (Oligo) or DMSO (Ctrl) treatment (n=3). f, Fold change of TCA cycle intermediates in +KRas versus -KRas cells (αKG, α-ketoglutarate) (n=4). g, Fold change of nucleotide triphosphates and deoxynucleotide triphosphates, glutathione (GSH) and glutathione disulfide (GSSG) in -KRas versus +KRas cells (n=4). Data are mean ± s.d.
Extended Data Figure 6
Extended Data Figure 6. Surviving cells in vitro and in vivo have an impaired glucose uptake
a, KRas expressing cells (+KRas) and surviving cells (-KRas) were incubated with 2NBDG for 6 hours then analyzed by flow-cytometry (n=3); a representative flow-cytometry analysis of spheres derived from two different tumors is reported. b, Mice bearing KRas expressing tumors (+KRas) and three-week regressed tumors (-KRas) were injected with a tail vein bolus of 2NBDG. After one hour tumors were explanted and analyzed by flow-cytometry upon gating on CD44+ DAPI- cells (n=3); a representative flow-cytometry analysis of two different tumors is reported. c-d, Tumor spheres derived from different genetic backgrounds (ink/arf-/- and p53-/-) were treated (+AB) or not with AZD8330 and BEZ235 for 7 days then plated in fresh stem cell medium. After 24hs medium was collected and analyzed by YSI analyzer for glucose uptake (c) and lactate production (d) (n=3). Data are mean ± s.d.
Extended Data Figure 7
Extended Data Figure 7. Fuel carbon contribution to TCA cycle and TCA branch metabolites
a-h, Isotopomer distribution for lactate (a), alanine (b), glutamate (c), aspartame (d), fumarate (e), citrate (f), isocitrate (g) and malate (h) in KRas expressing (+) and surviving cells (-) following steady-state tracing (36hs labeling) with uniformly carbon-13-labeled substrates: glucose, glutamine, palmitate and pyruvate (n=3). Data are mean ± s.d.
Extended Data Figure 8
Extended Data Figure 8. Differential sensitivity of tumor cells to OXPHOS inhibition
a, AnnexinV staining of cells treated with oligomycin 200nM (Oli) for 24hs shows a significant decrease in viability in surviving cells (-KRas). On the contrary control cells expressing KRas (+KRas) are minimally affected (n=3); a representative flow-cytometry analysis is reported. b, Effect of oligomycin (Oli), dicyclohexylcarbodiimide (DCCD), veturicidin (Vent), rotenone (Rot), antimycin (Anti) and DMSO (Ctrl) on spherogenic potential of KRas expressing (KRas+) and surviving tumor cells (KRas-) (n=4). c, In vivo treatment experimental scheme: mice were transplanted with tumor cells and fed with doxycycline in drinking water (+KRas, +Dox) until they developed tumors of 1 cm in diameter. Then doxycycline was withdrawn (-KRas, -Dox) and after 2 weeks, when tumors were regressed, mice were treated with oligomycin (0.5mg/kg, IP) or vehicle for 5 days a week, for two weeks. After treatment, KRas was re-induced (+Dox) and mice were monitored for tumor relapse. d, One dose of oligomycin (0.5mg/kg, IP) is sufficient to increase lactate concentration in plasma of treated mice after 4hs from injection (Oligo: oligomycin; Ctrl: vehicle) (n=4). e, Tumor volume of KRas expressing tumors treated with either vehicle or oligomycin 0.5mg/kg, 5 days a week, for two weeks. Treatment has started when tumors reached 5mm of diameter (5 mice per group). f, Surviving cells after treatment with oligomycin show signs of degeneration and epithelial remnants change their morphology. Red arrows indicate the presence of capillaries (red blood cells) indicating regressed tumors are vascularized (40×). g, Oligomycin (Oli) induces ROS production in KRas expressing cells (+KRas) and surviving cells (-KRas). Its effect is even stronger than that of positive control 4-hydroxynonenal (hne) (n=3). h, Glutathione levels in KRas expressing cells (+KRas) and surviving tumor cells (-KRas) before and after buthionine sulphoximine (BSO) treatment. Glutathione is increased in surviving cells and BSO treatment is effective in reducing its level (n=3). i, Effect of glutathione depletion on spherogenic potential of KRas expressing (+KRas) and surviving (-KRas) cells (n=3). j, ROS production in surviving cells after treatment with 4-hydroxynonenal (hne) and oligomycin (oli) in presence or absence of antioxidants: α-tocopherol (vitE), n-acetylcysteine (nac) and tetrakis (Tet) (n=2). k, Effect of oligomycin on spherogenic potential of surviving cells pretreated with antioxidants (n=4). Data are mean ± s.d.
Extended Data Figure 9
Extended Data Figure 9. Effect of mitochondrial downregulation in human tumor spheres and metabolic stress mediated by inhibition of autophagy
a, Effects of the combination of AZD8330 and BEZ235 (AZD+BEZ) on human tumor spheres. Some cells, usually doublets, are able to survive the treatment (5×). b, Immunoblots of human tumor spheres treated or not with the AZD+BEZ probed with anti-phospho-p42/44 (pErk), total-Erk (Erk), phospho- Akt (pAkt), Akt and (β-actin (Actin) antibodies, two independent tumors were reported. c, Annexin V staining of treated (AZD+BEZ) and control (Ctrl) cells after 4 days of treatment (n=3). d, Mitochondrial transmembrane potential (Δψm) of untreated (Ctrl) and treated (AZD+BEZ) human spheres with AZD8330/BEZ235 for 7 days (n=3), representative flow-cytometry analysis of two tumors. e-h, TFAM and TUFM were downregulated using two inducible shRNAs each (TFAM: #93, #95; TUFM: #63, #64) in human spheres expressing KRas (untreated) and cells surviving one week treatment with AZD8330 and BEZ235 (AZD+BEZ), after 5 days of shRNA induction cells were replated for evaluating their spherogenic capacity. e, Immunoblots of tumor spheres after 72hs of shRNA induction (+Dox) probed with anti-TFAM, TUFM and HSP90 antibodies, f, representative calcein staining after spheres replating. g-h, Effects of downregulation of TFAM and TUFM on spherogenic potential of untreated and treated cells respectively, data represent the average of two independent human tumors. i, Immunoblot of KRas expressing cells treated or not with oligomycin 200nM (Oligo, +/-) probed with anti-Thr172-phospho-AMPK and actin antibodies. Immunoblots of +KRas and -KRas cells treated with: j, etomoxir (Eto, 100 µM for 6hs) and k, bafilomycin (Baf, 50nM for 24hs) probed with anti-Thr172-phospho-AMPK and vinculin antibodies. l, AnnexinV staining of cells treated for 48hs with bafilomycin 50nM (Baf) and etomoxir 100µM (Eto) clearly shows a significant decrease in viability in surviving cells (-KRas). Controls cells expressing KRas (+KRas) are not affected (n=3); representative dot-plots are reported. Data are mean ± s.d.
Extended Data Figure 10
Extended Data Figure 10. Cells surviving oncogene ablation are engorged with autophagosomes and lysosomes and contain lipid droplets
a, Surviving cells (-KRas) have the cytoplasm full of phagosomes and autophagosomes, a feature absent in KRas expressing cells (+KRas) (TEM 7500×). b, Surviving cells are characterized by the presence of several lipid droplets (arrowheads) in the cytoplasm (TEM 7500×). c, Primers used for amplification of mitochondrial and lipid metabolic genes.
Figure 1
Figure 1. Cells surviving oncogene ablation are enriched in tumorigenic cells
a, Tumor volume before/after KRas ablation (+/-KRas)(n=6). b, Histology depicting tumor remnants (10×). c, Immunofluorescence of KRas-expressing tumor (+KRas), regressed tumor (-KRas) and regressed tumors 48hs after KRas re-activation (-KRas Re-ON) for Ki67 (red), CD44 (green) and DAPI (blue)(40×). d, Limiting dilution transplantation, TIC frequency. Genetic model: +KRas (black) vs -Kras (grey) ex vitro (n=4) or ex vivo (n=2). Pharmacological down-regulation: control (black) vs treated spheres (grey, AZD8330+BEZ235) (n=2). e, Exome sequencing: allele frequencies after KRas re-activation in SCs (RE-ON) vs KRas-expressing cells (Reference) at 40383 and 44182 SNVs for 2 independent tumors. f, AnnexinV in spheres +/-KRas with respect to CD44/CD133 expression (n=3). g, IHC of -KRas tumors for CD44 (blue) and CD133 (red)(20-40×). h, Immunophenotyping of +/-KRas tumors for CD44/CD133/aldefluor. i, GSEA of pathways enriched in -KRas vs +KRas cells. Data are mean ± s.d.
Figure 2
Figure 2. Surviving cells have more active mitochondria and impaired glycolysis
a-b, Immunoblot of +/-KRas cells probed with PGC1a (a) and VDAC1 (b) antibodies. c-d, In vivo immunofluorescence for CD44 (green), (c) PGC1a (red) and (d) VDAC1 (red) in +/-KRas tumors(60×). e, Oxygen consumption of +/-KRas cells (n=7). f, In vivo mitochondrial potential of +/-KRas tumors (n=3); representative flow-cytometry of two tumors, as control CCCP was added to acquired -KRas. g, Representative mitochondrial morphology in TEM (25000×). h, ATP levels of +/-KRas cells in response to oligomycin (Oli) or DMSO (Ctrl)(n=4). i, ECAR response of +/-KRas cells to glucose, oligomycin and 2DG (n=4). j, Fold change of glycolytic intermediates in +/-KRas cells (n=4). k-l, Glucose uptake (k) and lactate production (l) of +/-KRas cells (n=3). m, Isotopomer distribution for α-ketoglutarate following steady-state tracing with uniformly carbon-13-labeled substrates (n=3). Data are mean ± s.d.
Figure 3
Figure 3. OXPHOS inhibition specifically targets surviving cells
a, Effect of oligomycin (Oli) and DMSO (Ctrl) on spherogenic potential of +/-KRas cells (n=8), representative calcein staining. b, Kaplan-Meier overall survival after KRas reactivation in mice bearing regressed tumors treated two weeks with oligomycin or vehicle. c, Effects of oligomycin and DMSO on spherogenic potential of cells treated (AB) or not with AZD8330/BEZ235 in p53-/- and ink-arf-/- backgrounds (n=3). d, ECAR response of human tumor spheres treated (AZD+BEZ) and untreated (Ctrl) to glucose, oligomycin and 2DG (n=3). e, Effect of oligomycin and DMSO on spherogenic potential of human treated and untreated tumor cells (n=3). Data are mean ± s.d.
Figure 4
Figure 4. Surviving cells are not in metabolic stress and activate autophagy
a, Immunoblot of Thr172-phosphorylated and total AMPK, Ser79-phospho-acetyl-coA-carboxylase (pACC) and β-actin in +/-KRas cells. b, Immunoblot of -KRas cells treated or not with oligomycin probed with anti-Thr172-phospho-AMPK and β-actin antibodies. c, Immunoblot of LC3 and β-actin in +/-KRas cells. d, Autophagic flux of +/-KRas cells stably expressing GFP-LC3. Bafilomycin treatment rescues GFP (-KRas+Baf) (n= 3); representative flowcytometry of two tumors. e, Lipid droplet quantification in +/-KRas cells (n=4); representative flowcytometry of two tumors. f, Fusion between lipid droplets (red arrowheads) and autophagosomes (green arrowheads) in -KRas cells (TEM-25000×). g, Confocal microscopy for lipid droplets (Lipidtox-red), lysosomes (Lysotracker-green), Hoechst (blue) in -KRas spheres. h, Oxygen consumption of +/-KRas cells pretreated with bafilomycin, etomoxir or vehicle (n= 4). i, Effect of bafilomycin and etomoxir on spherogenic potential of +/-KRas cells (n=6). Data are mean ± s.d.

Comment in

Similar articles

Cited by

References

    1. NCI/SEER. 2012 http://seer.cancer.gov/statfacts/html/pancreas.html - incidence-mortality.
    1. Ying H, et al. Oncogenic Kras maintains pancreatic tumors through regulation of anabolic glucose metabolism. Cell. 2012;149:656–670. doi: 10.1016/j.cell.2012.01.058. - DOI - PMC - PubMed
    1. Karnoub AE, Weinberg RA. Ras oncogenes: split personalities. Nature reviews Molecular cell biology. 2008;9:517–531. doi: 10.1038/nrm2438. - DOI - PMC - PubMed
    1. Kantarjian H, et al. Hematologic and cytogenetic responses to imatinib mesylate in chronic myelogenous leukemia. The New England journal of medicine. 2002;346:645–652. doi: 10.1056/NEJMoa011573. - DOI - PubMed
    1. Flaherty KT, et al. Inhibition of mutated, activated BRAF in metastatic melanoma. The New England journal of medicine. 2010;363:809–819. doi: 10.1056/NEJMoa1002011. - DOI - PMC - PubMed

Publication types

MeSH terms

Substances

Associated data