. 2014 Oct 16;514(7522):380-4.
doi: 10.1038/nature13589. Epub 2014 Aug 6.

CRISPR-mediated direct mutation of cancer genes in the mouse liver

Affiliations

CRISPR-mediated direct mutation of cancer genes in the mouse liver

Wen Xue et al. Nature. .

Abstract

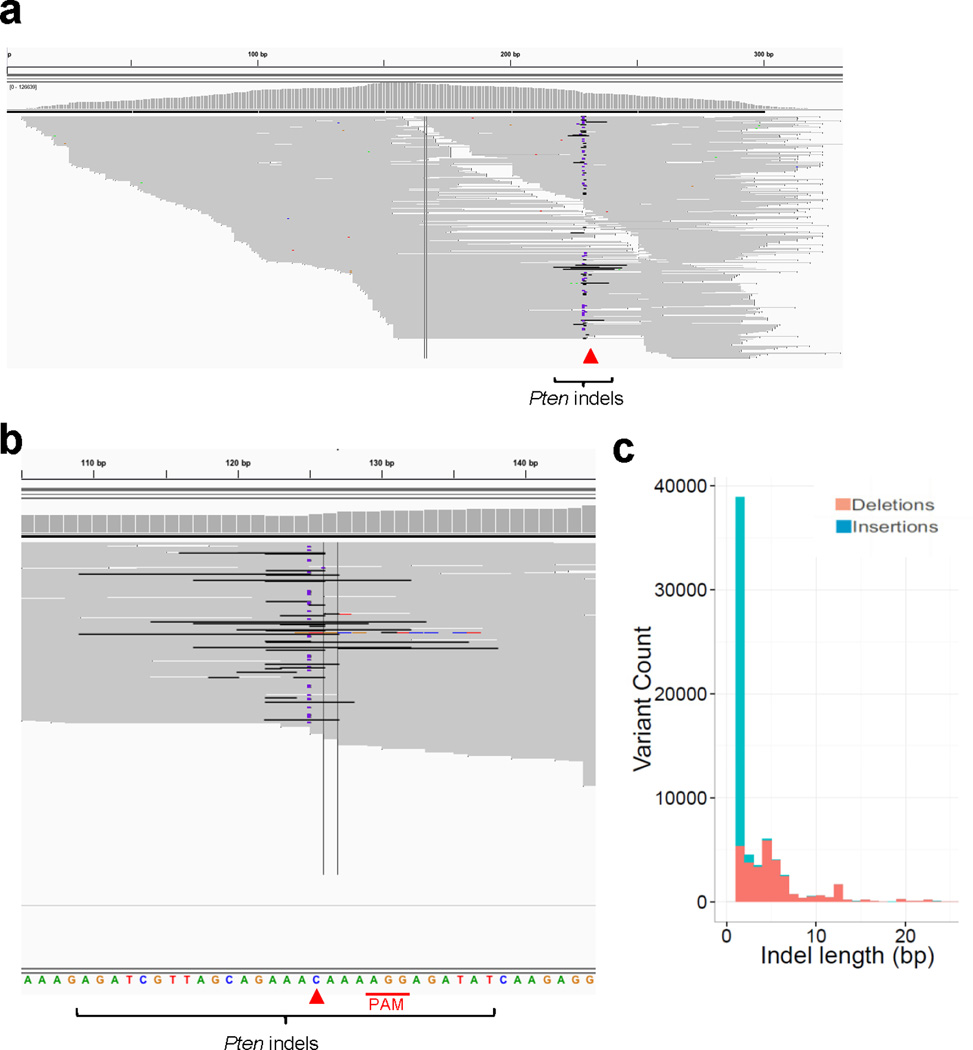
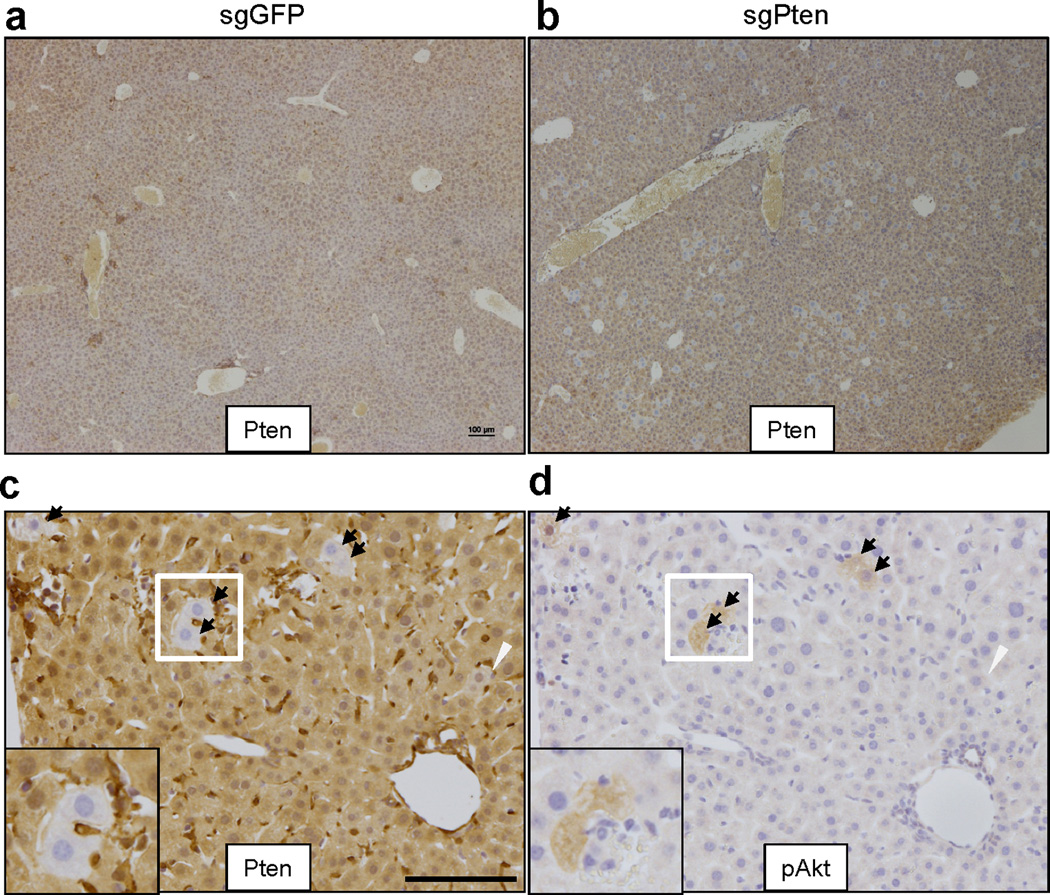
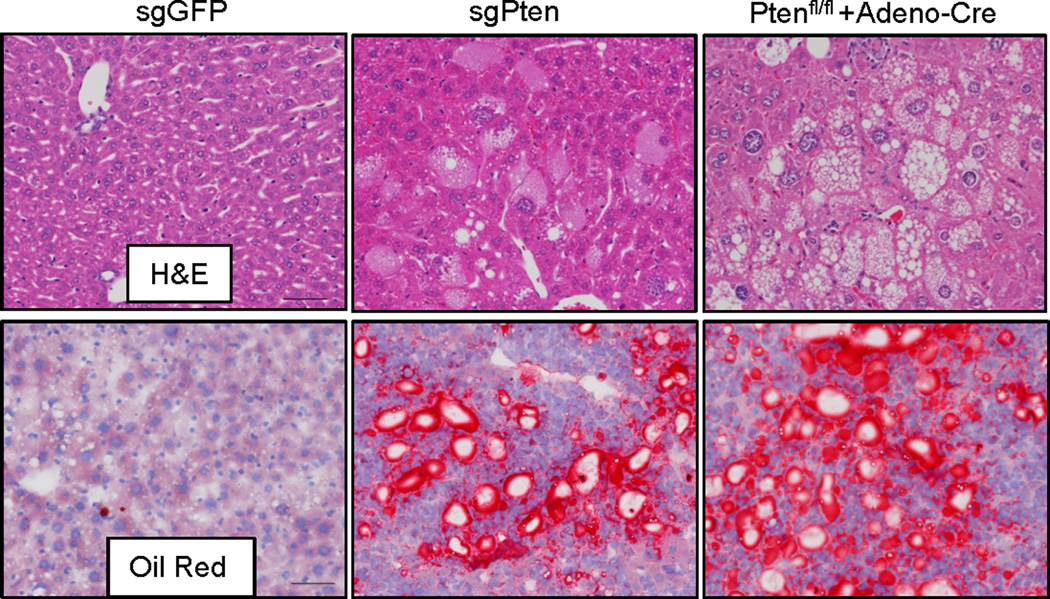
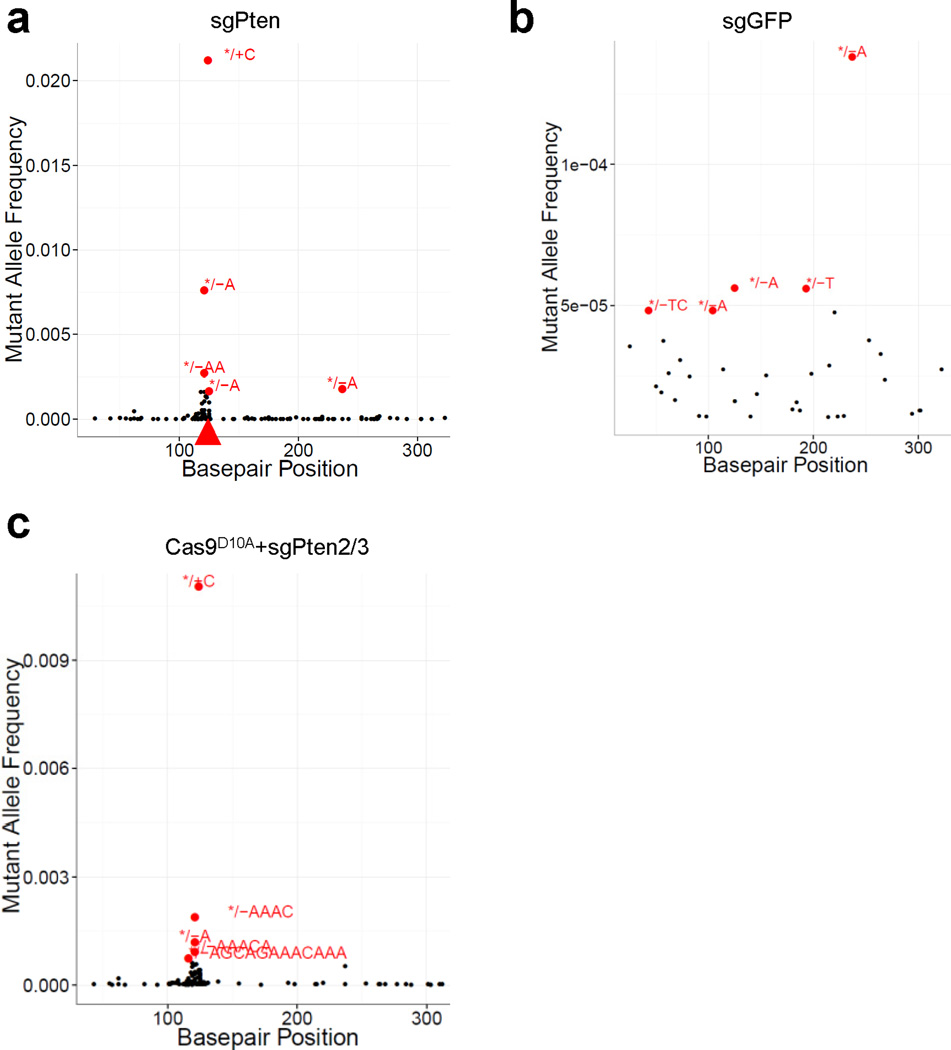
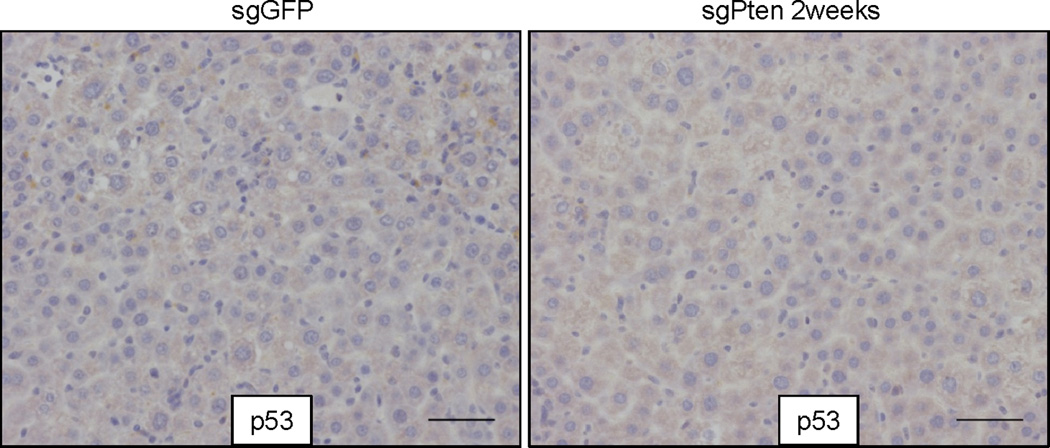
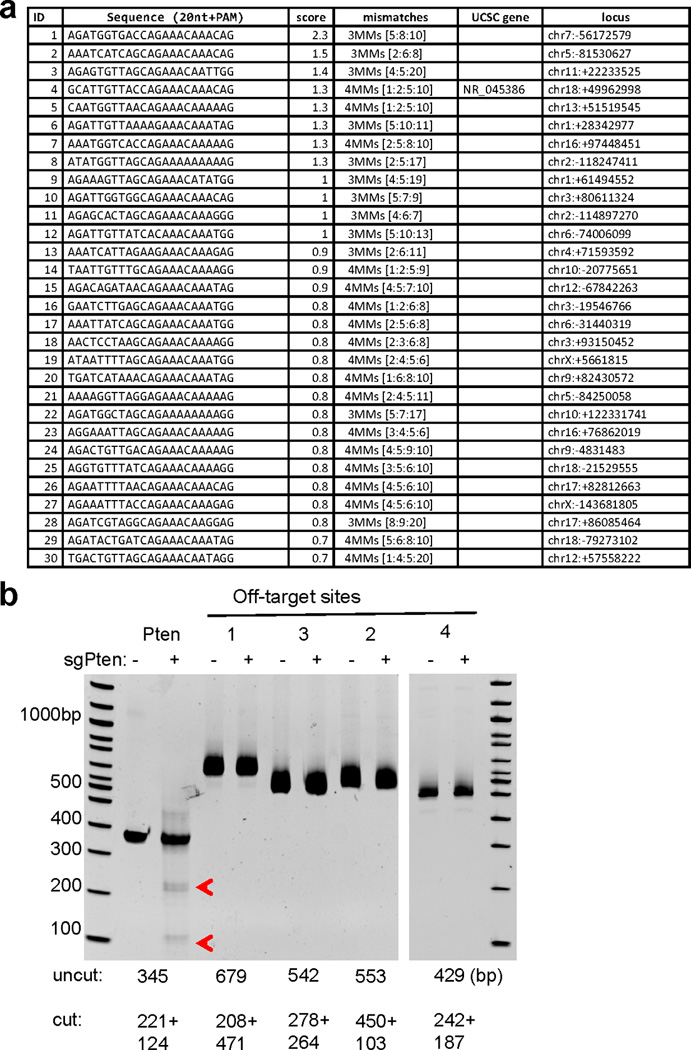
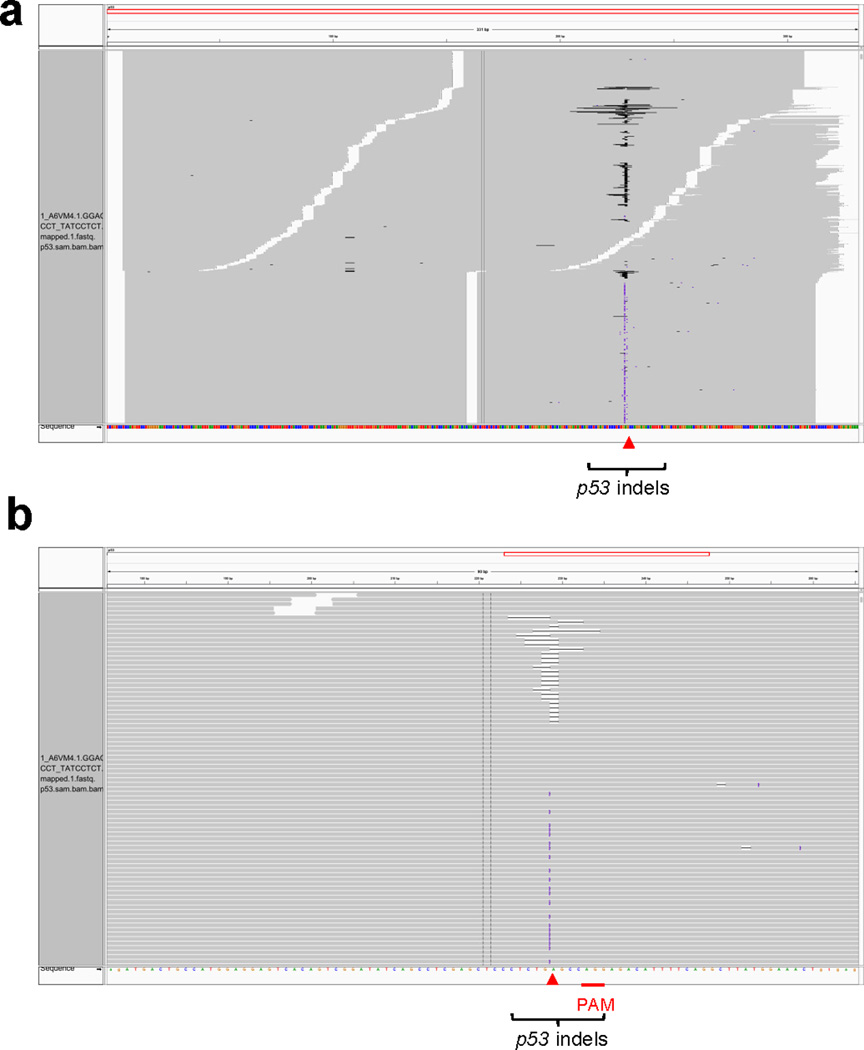
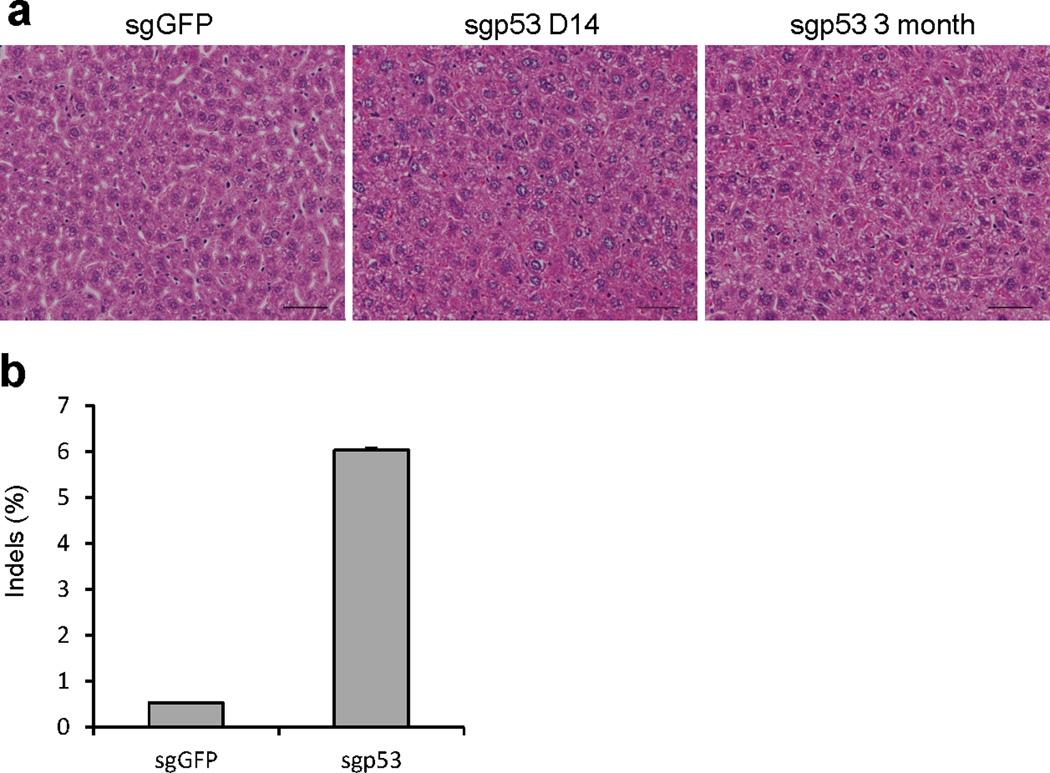
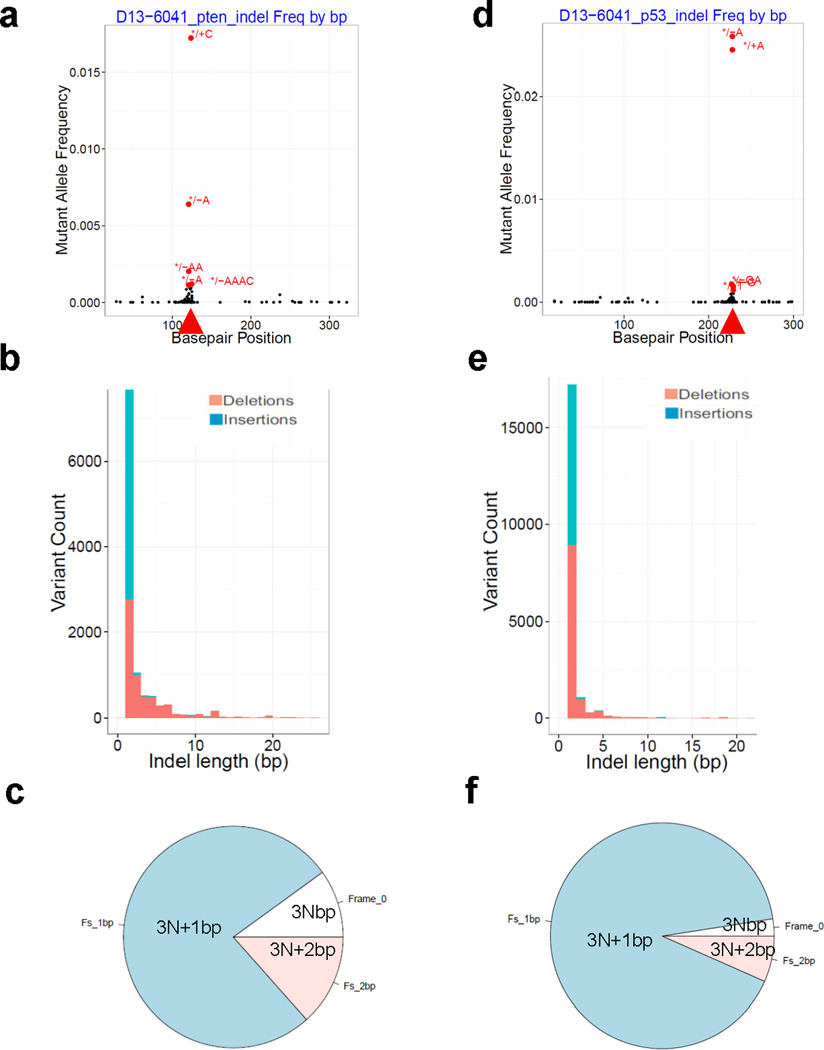
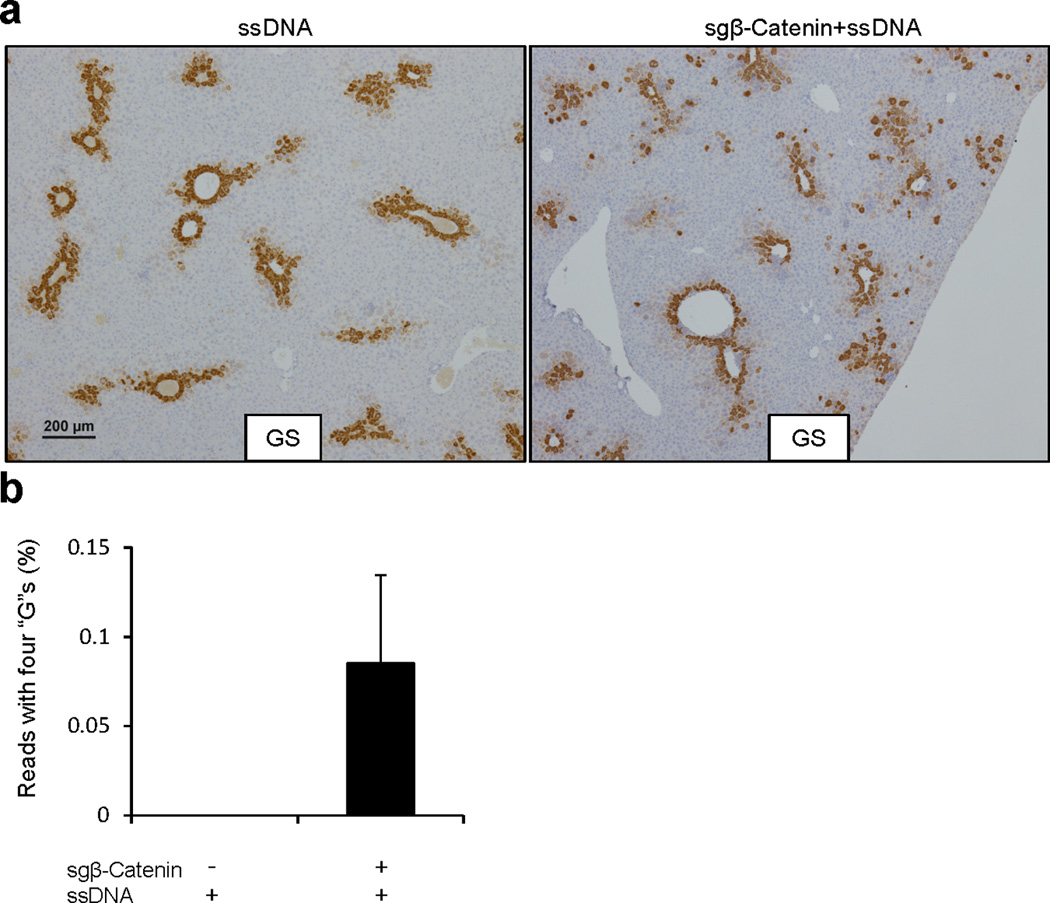
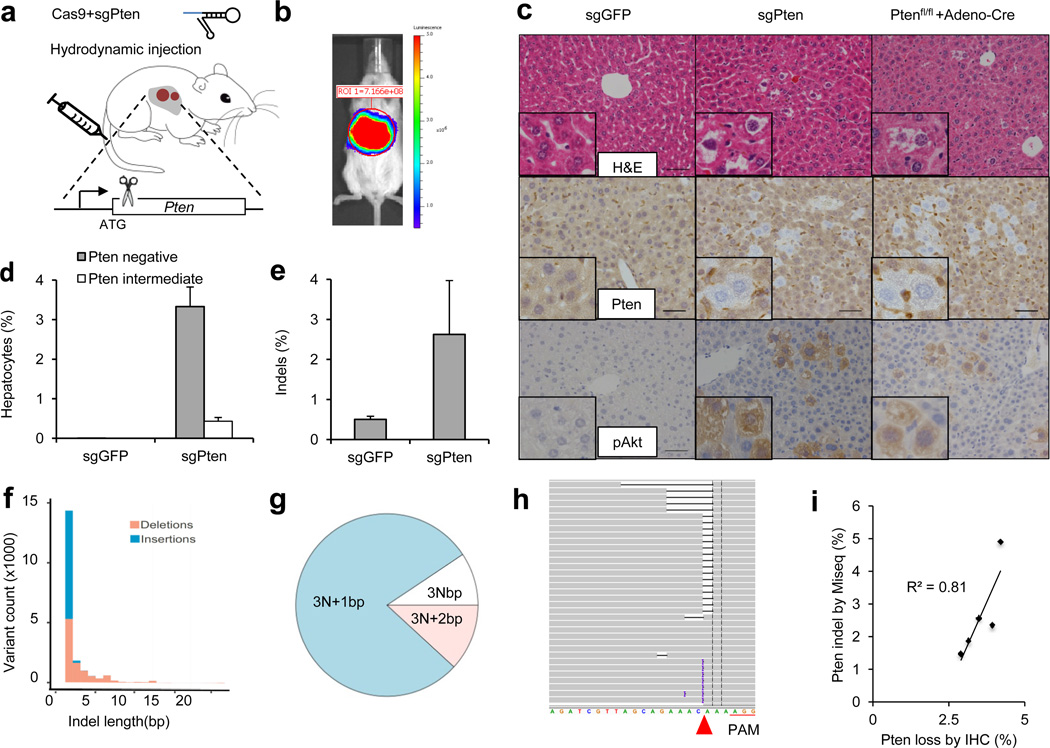
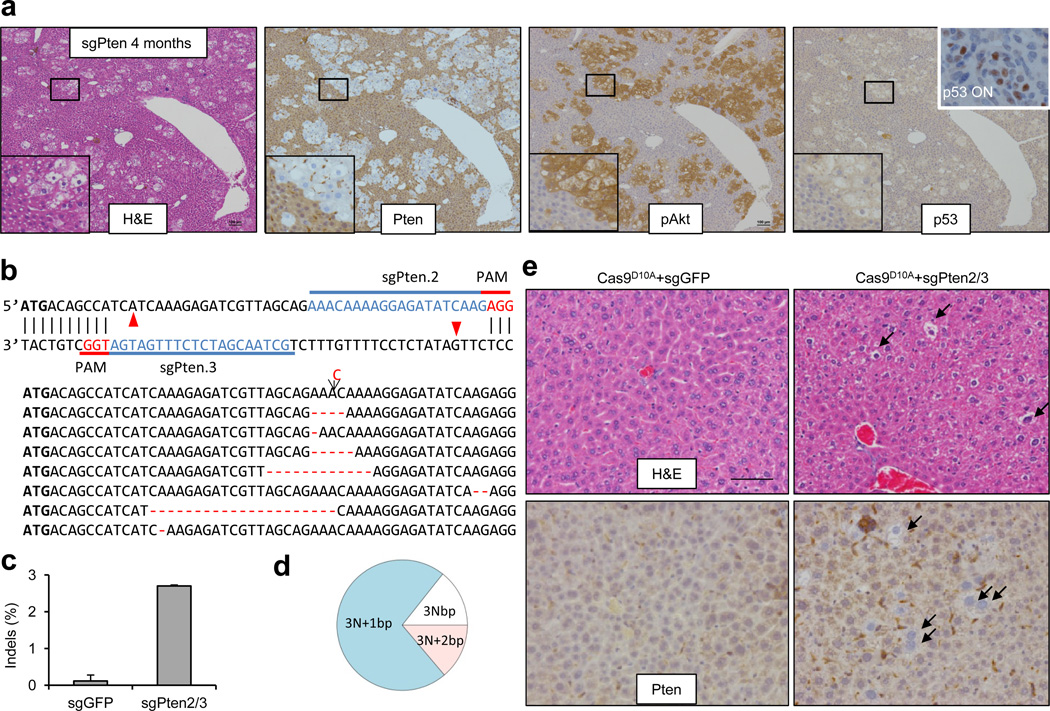
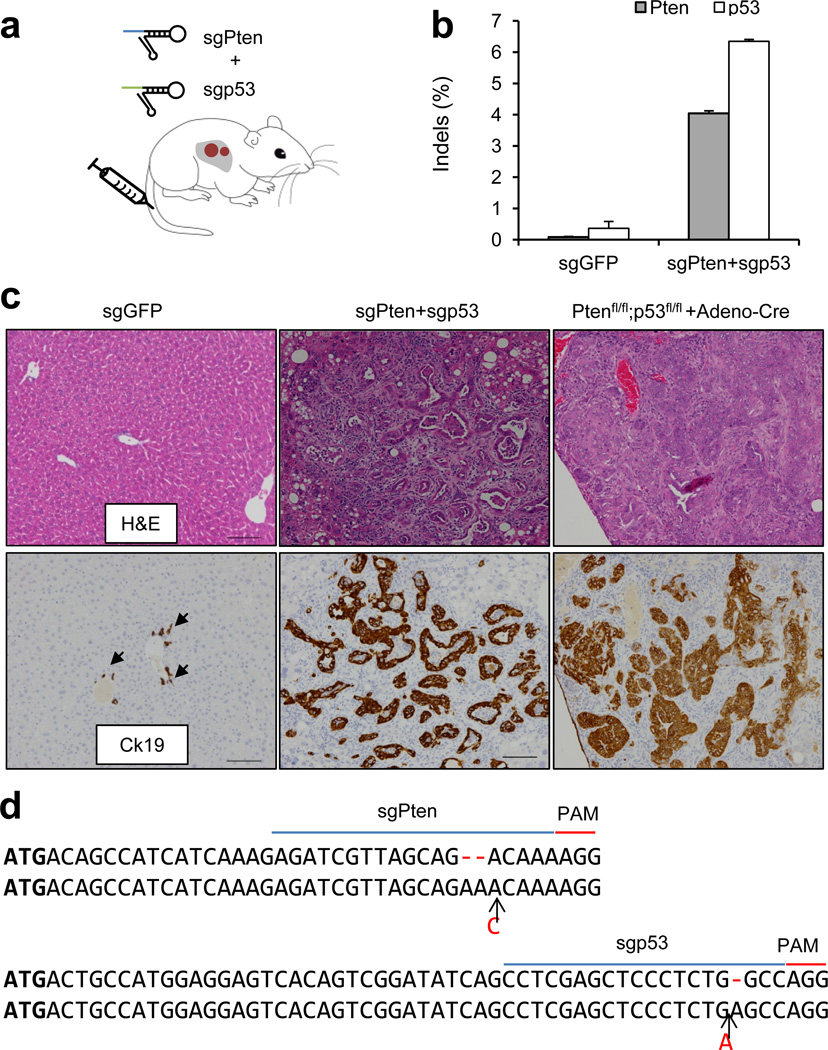
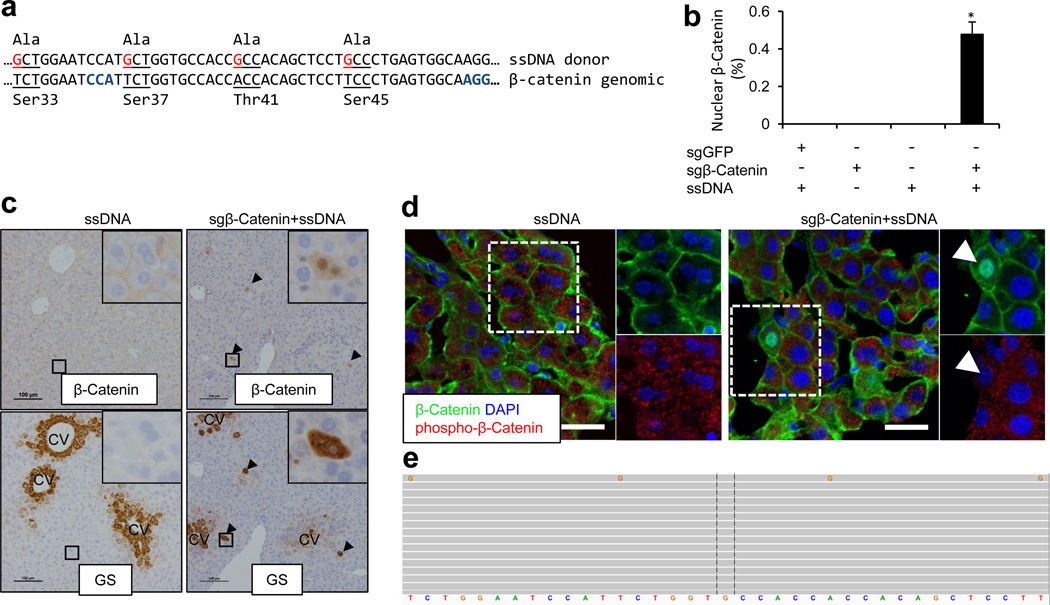
The study of cancer genes in mouse models has traditionally relied on genetically-engineered strains made via transgenesis or gene targeting in embryonic stem cells. Here we describe a new method of cancer model generation using the CRISPR/Cas (clustered regularly interspaced short palindromic repeats/CRISPR-associated proteins) system in vivo in wild-type mice. We used hydrodynamic injection to deliver a CRISPR plasmid DNA expressing Cas9 and single guide RNAs (sgRNAs) to the liver that directly target the tumour suppressor genes Pten (ref. 5) and p53 (also known as TP53 and Trp53) (ref. 6), alone and in combination. CRISPR-mediated Pten mutation led to elevated Akt phosphorylation and lipid accumulation in hepatocytes, phenocopying the effects of deletion of the gene using Cre-LoxP technology. Simultaneous targeting of Pten and p53 induced liver tumours that mimicked those caused by Cre-loxP-mediated deletion of Pten and p53. DNA sequencing of liver and tumour tissue revealed insertion or deletion mutations of the tumour suppressor genes, including bi-allelic mutations of both Pten and p53 in tumours. Furthermore, co-injection of Cas9 plasmids harbouring sgRNAs targeting the β-catenin gene and a single-stranded DNA oligonucleotide donor carrying activating point mutations led to the generation of hepatocytes with nuclear localization of β-catenin. This study demonstrates the feasibility of direct mutation of tumour suppressor genes and oncogenes in the liver using the CRISPR/Cas system, which presents a new avenue for rapid development of liver cancer models and functional genomics.


Figures

Extended Data Figure 1
Extended Data Figure 1. Representative Pten indels in sgPten treated 3T3 cells
mouse 3T3 cells were co-transfected with sgPten and a GFP plasmid. The highest 20% of GFP positive cells were sorted to enrich for cells expressing sgPten. Deep sequencing of the Pten locus revealed 36.4% Pten indels in this context (Supplementary Table 5), presumably due to the more efficient delivery of sgPten via cell culture transfection and sorting. Red arrowheads denote predicted Cas9 cutting sites. Black or purple bars in grey sequencing reads indicate deletions or insertions, respectively. Other colors indicate SNPs. (a) Pten PCR region. (b) Zoom in view. n=1 DNA sample. (c) Distribution of Pten indel length.
Extended Data Figure 2
(a–b) Low magnification images of Pten IHC in sgGFP (a) and sgPten (b) treated mice. Scale bar is 100μm. (c-d) IHC on serial sections from sgPten treated mice. Black arrows denote cells with negative Pten staining and positive pAkt staining. White arrowhead denotes cells with intermediate Pten staining, potentially indicating heterozygous Pten mutation or multi-nucleated hepatocytes with partial Pten loss. Insets show high magnification IHC images. Scale bar is 100μm. n=5 mice. The frequency of Pten-deficient cells is likely a reflection of the transduction efficiency following hydrodynamic injection and the time required to achieve mutation. A recent study by our groups has shown that ~17% of hepatocytes were FLAG-Cas9 positive by IHC one day following hydrodynamic injection, only 1.4% of cells on day 7, and less than 0.3% at one month. Given that Cas9-mediated genome editing usually takes more than 48 hours, the fraction of hepatocytes that productively express Cas9 and an sgRNA after hydrodynamic injection is estimated to be less than 17%.
Extended Data Figure 3
Extended Data Figure 3. sgPten induces lipid accumulation in the liver
FVB mice were with injected with sgGFP or sgPten (n=5). 2 months later, liver sections were stained for Oil Red, a marker for lipid accumulation. Scale bars are 50μm.
Extended Data Figure 4
Extended Data Figure 4. sgPten generated indels at the Pten locus in the liver
(a) Representative indel frequency in (a). */+C denotes “C” insertion and */-AA denotes “AA” deletion. Basepair position denotes position along the Pten reference sequence. (b) Representative Pten indel frequency in sgGFP mice. Note the low mutant allele frequency compared to (a). sgPten samples show indels peaking at the predicted Cas9 cutting site while sgGFP indels distribute randomly. (c) Representative indel frequency in Cas9D10A+sgPten2/3 treated mice.
Extended Data Figure 5
Extended Data Figure 5. Pten deletion in the liver does not induce p53
Liver sections from sgGFP or sgPten-treated mice at 2 weeks were stained for p53 IHC. n=3 mice. Scale bars are 50μm. Positive control from a p53 restoration tumor was shown in the Fig. 2a inset (p53 ON) (Xue et al, 2007).
Extended Data Figure 6
Extended Data Figure 6. Assessing off-target cutting of sgPten
(a) Top 30 potential off-target sites for sgPten in the mouse genome. Score is likelihood of off-target binding. Only site 4 is in the exon region of NR_045386, which is a long non-coding RNA. (b) Surveyor assay in sgGFP (-) and sgPten (+) treated liver genomic DNA. Pten and Pten Off targets sites 1,2,3 and 4 were PCR amplified .Predicted size of uncut and cut bands are indicated. Red arrowheads indicate denote surveyor nuclease-cleaved Pten PCR products. The data are representative of two independent liver samples.
Extended Data Figure 7
Extended Data Figure 7. Representative p53 indels in sgp53 treated 3T3 cells
Red arrowheads denote predicted Cas9 cutting sites. Black or purple bars in grey sequencing reads indicate deletions or insertions, respectively. (a) p53 PCR region. (b) Zoom in view. n=1 DNA sample.
Extended Data Figure 8
Extended Data Figure 8. Analyzing sgp53-treated livers
(a) Histology of sgp53-treated livers. Scale bars=50μm. n=3 mice. (b) p53 indel frequency was measured by MiSeq at day 14. Error bars are s.d. (n=2 mice).
Extended Data Figure 9
Extended Data Figure 9. sgPten and sgp53 generated indels in the liver
sgPten and sgp53 were co-injected into FVB mice. Representative analysis of MiSeq is shown. n=2 mice. (a-c) Pten locus. (d-f) p53 locus. (a, d) Indel frequency. */+ indicates insertions and */– indicates deletions. Basepair position denotes position along the Pten or p53 reference sequences. Arrowheads denote predicted Cas9 cutting sites. (b, e) Distribution of indel length. (c, f) Distribution of indel frame phase. Frame phase of indels was calculated as the length of indels modulus 3.
Extended Data Figure 10
(a) Low magnification images of glutamine synthetase (GS) IHC as in Fig. 4c. (b) Frequency of Ctnnb1 deep sequencing reads with all four “G” nucleotides. The rate of β-Catenin donor integration was calculated as donor allele frequency. n=2 mice.
Figure 1
Figure 1. Hydrodynamic injection of CRISPR deletes Pten in a subset of hepatocytes in mice
(a) pX330 plasmids expressing Cas9 and sgRNA targeting Pten (sgPten) were hydrodynamically injected into wild-type FVB mice to transiently express the CRISPR components in hepatocytes. (b) Bioluminescence imaging of mice hydrodynamically injected with a Luciferase plasmid (n=3). (c) Representative H&E and IHC staining of FVB mice injected with sgGFP (as a control) or sgPten, and Ptenfl/fl mice injected with Adeno-Cre for 2 weeks. Note the hepatocytes with clear cytoplasm on H&E sections, indicating lipid accumulation. Scale bars are 50μm. (d) Percentage of hepatocytes with negative or intermediate Pten staining. Error bars are s.d. (n=5 mice). (e) Pten indel frequency in the total liver genomic DNA (n=3 mice for sgGFP and n=5 mice for sgPten). (f-h) Representative Pten indels in sgPten treated mice. (f) Distribution of indel length. (g) Distribution of indel frame phase calculated as the length of indels modulus 3. (h) Representative IGV views of Pten indels in sgPten-treated mice. Black or purple bars indicate deletions or insertions, respectively. Arrowhead denotes predicted Cas9 cutting site. A full list of indels are in Supplementary Table 4. (i) Correlation between Pten loss determined by IHC and deep sequencing. Each dot is an individual mouse treated with sgPten.
Figure 2
Figure 2. Long term effects of sgPten in the liver and off-set CRISPR double nickase strategy
(a) IHC on serial sections from sgPten-treated mice at 4 months post injection. Scale bars are 100μm. n=3 mice. The lower-left insets are high-magnification views. The “p53 ON” inset is a p53 restored liver tumor as a positive control. (b) FVB mice were injected with Cas9D10A plus sgGFP (as a control) or plus a pair of off-set sgRNAs targeting Pten (sgPten2 and sgPten3) to introduce double nicking. Red arrowheads denote predicted Cas9D10A cutting sites. Total liver genomic DNA was analyzed by deep sequencing for Pten indels. Representative sequences were shown. (c) Frequency of Pten indels (n=2 mice). (d) Frame phase of Pten indels calculated as the length of indels modulus 3. (e) H&E and Pten IHC staining of liver sections. Arrows denote cells showing negative Pten staining or lipid accumulation. n=5 mice. Scale bar is 50μm.
Figure 3
Figure 3. Multiplexed CRISPR targeting Pten and p53 induces tumor formation in murine liver
(a) pX330 plasmids expressing sgPten and sgp53 were hydrodynamically injected into FVB mice. (b) Frequency of Pten and p53 indels quantified by MiSeq (n=2 mice) at 14 days post injection. (c) Representative H&E and IHC staining of FVB mice injected with sgGFP (as a control) or sgPten+sgp53, and Ptenfl/fl;p53fl/fl mice injected with Adeno-Cre. Arrows indicate Ck19+ bile duct cells in sgGFP mice. Scale bars are 100μm. n=5 mice. (d) Representative sequences of Pten and p53 loci in sgPten+sgp53 induced liver tumors (n=5 tumors).
Figure 4
Figure 4. CRISPR introduces β-Catenin mutations in the liver
(a) FVB mice were co-injected with two sgRNAs targeting the β-Catenin gene Ctnnb1 (sgβ-Catenin) and a 200nt single-stranded DNA (ssDNA) oligo harboring four alanine point mutations (red) which abolish phosphorylation of serine and threonine sites of β-Catenin. Codons are underlined. PAM sequences are marked in blue. (b) Quantification of hepatocytes with nuclear β-Catenin IHC staining at day 7. Mice were injected with indicated combination. sgGFP serves as a control sgRNA. n=5 mice. *, p<0.05. (c) IHC on serial liver sections. Glutamine synthetase (GS) is normally expressed surrounding the central veins (left). Arrowheads indicate overlap of β-Catenin and GS staining outside the central vein (CV) region (right). Scale bars are 100μm. (d) Single confocal sections show nuclear β-Catenin and loss of cytoplasmic phospho-β-Catenin in the cell indicated by an arrow. Scale bars are 100 µm. (e) Representative Ctnnb1 deep sequencing reads in sgβ-Catenin+ssDNA treated mice. Each grey bar represents a sequencing read. Ctnnb1 reference sequence is shown in the bottom. Reads match the reference sequence are in grey. Variant bases are in colors (G in orange). n=2 mice.

Comment in

Similar articles

Cited by

References

    1. Van Dyke T, Jacks T. Cancer modeling in the modern era: progress and challenges. Cell. 2002;108:135–144. - PubMed
    1. Cong L, et al. Multiplex genome engineering using CRISPR/Cas systems. Science. 2013;339:819–823. - PMC - PubMed
    1. Jinek M, et al. A programmable dual-RNA-guided DNA endonuclease in adaptive bacterial immunity. Science. 2012;337:816–821. - PMC - PubMed
    1. Mali P, et al. RNA-guided human genome engineering via Cas9. Science. 2013;339:823–826. - PMC - PubMed
    1. Song MS, Salmena L, Pandolfi PP. The functions and regulation of the PTEN tumour suppressor. Nat Rev Mol Cell Biol. 2013;13:283–296. - PubMed

Publication types

MeSH terms

Associated data