

Prescription opioid use among disabled Medicare beneficiaries: intensity, trends, and regional variation
- PMID: 25119955
- PMCID: PMC4151179
- DOI: 10.1097/MLR.0000000000000183
Prescription opioid use among disabled Medicare beneficiaries: intensity, trends, and regional variation
Abstract
Background: Prescription opioid use and overdose deaths are increasing in the United States. Among disabled Medicare beneficiaries under the age of 65, the rise in musculoskeletal conditions as qualifying diagnoses suggests that opioid analgesic use may be common and increasing, raising safety concerns.
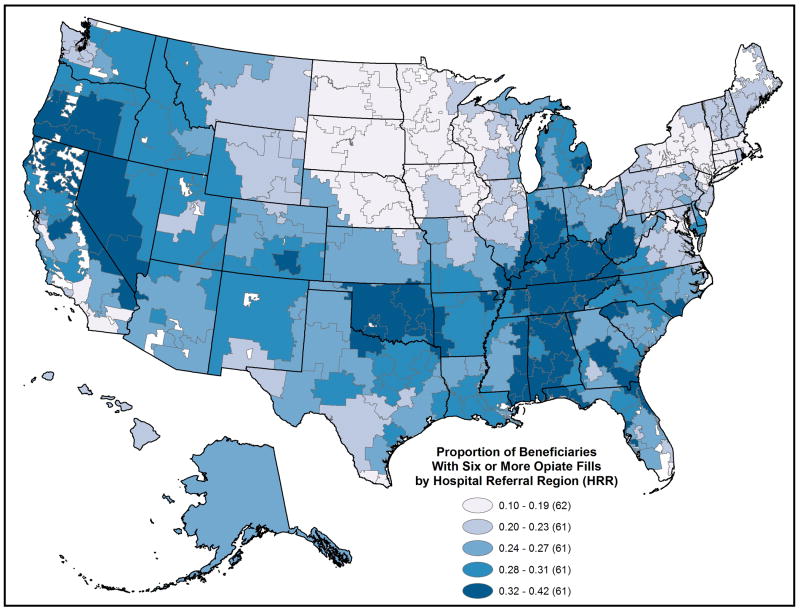
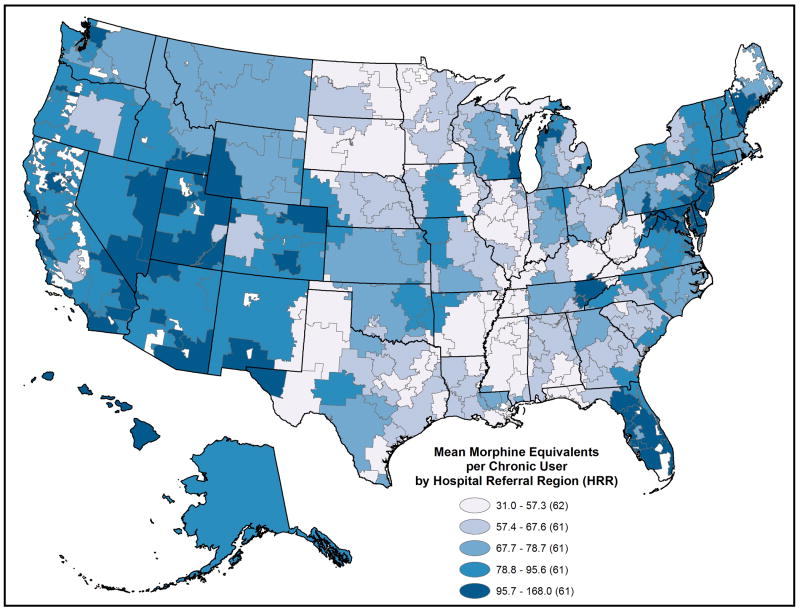
Methods: From a 40% random-sample Medicare denominator, we identified fee-for-service beneficiaries under the age of 65 and created annual enrollment cohorts from 2007 to 2011 (6.4 million person-years). We obtained adjusted, annual opioid use measures: any use, chronic use (≥ 6 prescriptions), intensity of use [daily morphine equivalent dose (MED)], and opioid prescribers per user. Geographic variation was studied across Hospital Referral Regions.
Results: Most measures peaked in 2010. The adjusted proportion with any opioid use was 43.9% in 2007, 44.7% in 2010, and 43.7% in 2011. The proportion with chronic use rose from 21.4% in 2007 to 23.1% in 2011. Among chronic users: mean MED peaked at 81.3 mg in 2010, declining to 77.4 mg in 2011; in 2011, 19.8% received ≥ 100 mg MED; 10.4% received ≥ 200 mg. In 2011, Hospital Referral Region-level measures varied broadly (5th-95th percentile): any use: 33.0%-58.6%, chronic use: 13.9%-36.6%; among chronic users, mean MED: 45 mg-125 mg; mean annual opioid prescribers: 2.4-3.7.
Conclusions: Among these beneficiaries, opioid use was common. Although intensity stabilized, the population using opioids chronically grew. Variation shows a lack of a standardized approach and reveals regions with mean MED at levels associated with overdose risk. Future work should assess outcomes, chronic use predictors, and policies balancing pain control and safety.
Figures
References
-
- Centers for Disease C, Prevention. Vital signs: overdoses of prescription opioid pain relievers---United States, 1999--2008. MMWR Morbidity and mortality weekly report. 2011 Nov 4;60(43):1487–1492. - PubMed
-
- U.S. Social Security Administration. Annual Statistical Report on the Social Security Disability Insurance Program, 2012. [Accessed July 1, 2013];2011 http://www.socialsecurity.gov/policy/docs/statcomps/di_asr/2011/index.html.
-
- Autor DH, Duggan MG. The growth in the Social Security Disability rolls: a fiscal crisis unfolding. The journal of economic perspectives : a journal of the American Economic Association. 2006 Summer;20(3):71–96. - PubMed
-
- Ballantyne JC, Mao J. Opioid therapy for chronic pain. The New England journal of medicine. 2003 Nov 13;349(20):1943–1953. - PubMed
-
- Paulozzi LJ, Ryan GW. Opioid analgesics and rates of fatal drug poisoning in the United States. Am J Prev Med. 2006 Dec;31(6):506–511. - PubMed
Publication types
MeSH terms
Substances
Grants and funding
LinkOut - more resources
Full Text Sources
Other Literature Sources
Medical
