. 2014 Aug 13;9(8):e104504.
doi: 10.1371/journal.pone.0104504. eCollection 2014.

Identification of significant features by the Global Mean Rank test

Affiliations

Identification of significant features by the Global Mean Rank test

Martin Klammer et al. PLoS One. .

Abstract

With the introduction of omics-technologies such as transcriptomics and proteomics, numerous methods for the reliable identification of significantly regulated features (genes, proteins, etc.) have been developed. Experimental practice requires these tests to successfully deal with conditions such as small numbers of replicates, missing values, non-normally distributed expression levels, and non-identical distributions of features. With the MeanRank test we aimed at developing a test that performs robustly under these conditions, while favorably scaling with the number of replicates. The test proposed here is a global one-sample location test, which is based on the mean ranks across replicates, and internally estimates and controls the false discovery rate. Furthermore, missing data is accounted for without the need of imputation. In extensive simulations comparing MeanRank to other frequently used methods, we found that it performs well with small and large numbers of replicates, feature dependent variance between replicates, and variable regulation across features on simulation data and a recent two-color microarray spike-in dataset. The tests were then used to identify significant changes in the phosphoproteomes of cancer cells induced by the kinase inhibitors erlotinib and 3-MB-PP1 in two independently published mass spectrometry-based studies. MeanRank outperformed the other global rank-based methods applied in this study. Compared to the popular Significance Analysis of Microarrays and Linear Models for Microarray methods, MeanRank performed similar or better. Furthermore, MeanRank exhibits more consistent behavior regarding the degree of regulation and is robust against the choice of preprocessing methods. MeanRank does not require any imputation of missing values, is easy to understand, and yields results that are easy to interpret. The software implementing the algorithm is freely available for academic and commercial use.


Conflict of interest statement

Competing Interests: M. K., N. D. and C. S. are employees of Evotec. There are no patents, products in development or marketed products to declare. This does not alter the authors' adherence to all the PLOS ONE policies on sharing data and materials.

Figures

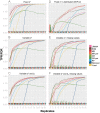
Figure 1
Figure 1. Performance on simulated data.
Performance plot of one-sample significance tests under different simulation settings. Traces show the true positive rate (TPR) of the respective tests for a given number of replicates. Bars at bottom denote the false discovery rate (FDR). TPR and FDR are averaged over ten independent simulations. All tests were set to control the FDR at 0.05.
Figure 2
Figure 2. Performance on spike-in data.
Performance comparison of MeanRank (red), SAM (brown), and LIMMA (cyan) on the ‘Ag-Spike’ microarray dataset . TPR and FDR shown by lines and bars, respectively. Different combinations of preprocessing investigated by the authors of the original study are shown on the x-axis.
Figure 3
Figure 3. Volcano plot of spike-in data.
Volcano plot of the ‘Ag-Spike’ data, background corrected by normexp and normalized with loess. This combination of preprocessing steps was found to deliver the best performance by the authors of the original study . Genes are represented as points. Non-differentially expressed genes are scattered around Mean = 0 on the x-axis. Differentially expressed genes, as identified by the respective methods are colored.
Figure 4
Figure 4. Volcano plot of AML data.
Volcano plot of the phosphoproteomic data published by Weber et al. . Significantly regulated phosphorylation sites are shown by colored circles as identified by SAM (left), the MeanRank test (right center), and in the original study (right).
Figure 5
Figure 5. Volcano plot of Plk1-kinase-inhibited cells data.
Volcano plot of the phosphoproteomic data of cells treated with an Plk1 tyrosine kinase inhibitor versus control . Significantly regulated phosphorylation sites shown in colored circles as identified by MeanRank test, SAM, LIMMA (from left). The two rightmost volcano plots shows differences in detected phosphorylation sites by MeanRank/SAM and MeanRank/LIMMA.

References

    1. Geiger T, Wehner A, Schaab C, Cox J, Mann M (2012) Comparative proteomic analysis of eleven common cell lines reveals ubiquitous but varying expression of most proteins. Mol Cell Proteomics 11: M111.014050. - PMC - PubMed
    1. Olsen JV, Blagoev B, Gnad F, Macek B, Kumar C, et al. (2006) Global, in vivo, and site-specific phosphorylation dynamics in signaling networks. Cell 127: 635–648. - PubMed
    1. Huttlin EL, Jedrychowski MP, Elias JE, Goswami T, Rad R, et al. (2010) A tissue-specific atlas of mouse protein phosphorylation and expression. Cell 143: 1174–1189. - PMC - PubMed
    1. Klammer M, Kaminski M, Zedler A, Oppermann F, Blencke S, et al. (2012) Phosphosignature predicts dasatinib response in non-small cell lung cancer. Mol Cell Proteomics 11: 651–668. - PMC - PubMed
    1. Storey J (2002) A direct approach to false discovery rates. Journal of the Royal Statistical Society: Series B (Statistical Methodology) 64: 479–498.

Publication types

Substances